
 Customer Experience
  Blog
Blog  Business Communication
  Leadership
  Marketing & Sales
  Productivity
  VoIP
VoIP 


Customer experience (CX) is no longer a “soft” metric—it’s a growth lever. In a BCG survey, companies that prioritize CX saw 190% higher three-year revenue growth than those that don’t. But to improve CX, you need more than instincts; you need a measurement system that tells you what’s working, what’s broken, and where to focus next.
So, how do you measure customer experience without drowning in data? The answer is to track a key set of CX metrics that cover the full journey—loyalty, effort, satisfaction, operational performance, and retention. This guide breaks down 10 essential customer experience metrics, why each one matters, how to calculate it, and how to use the results to drive real improvements.
What Are Customer Experience (CX) Metrics?
Customer experience metrics are measurable indicators that show how customers perceive and interact with your brand throughout their customer journey. These key performance indicators (KPIs) measure the health of your customer relationships and predict future growth.
CX metrics uncover what’s working and what’s not. These customer insights influence satisfaction, loyalty, and long-term business growth. Tracking the right CX metrics is critical for making informed decisions, strengthening customer relationships, and maintaining a competitive market position.
Top 10 Customer Experience Metrics at a Glance
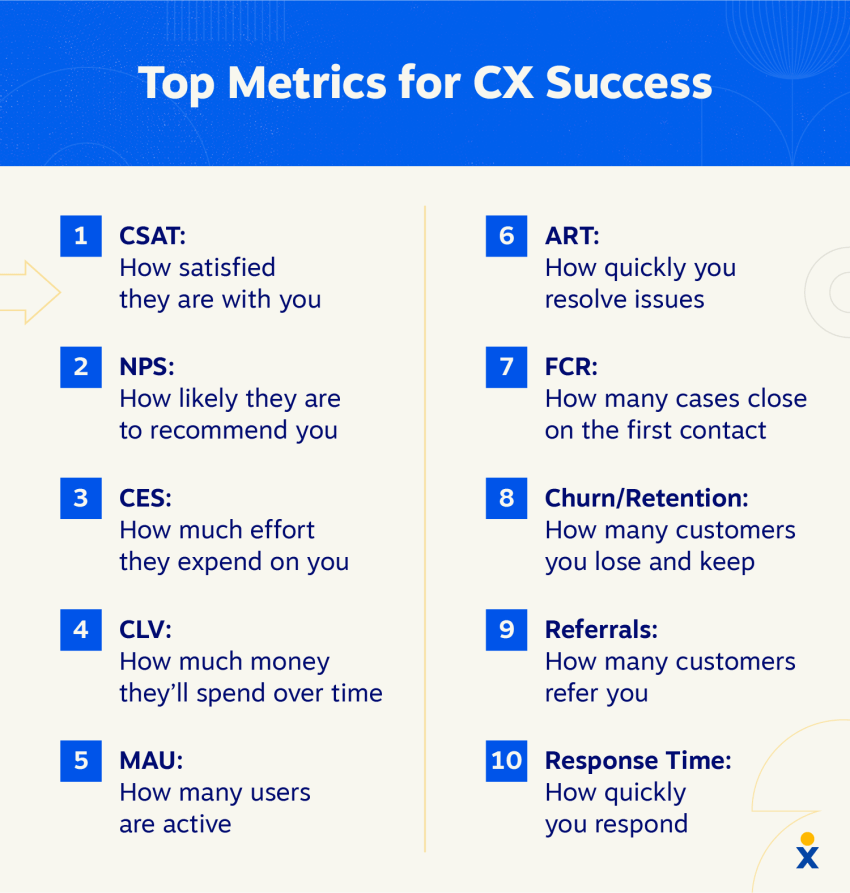
Here’s an overview of the most important CX metrics that businesses depend on:
| Metric | What it is | Its key purpose |
|---|---|---|
| Customer satisfaction (CSAT) | Measures how satisfied customers are with a product, service, or interaction | Gauge immediate satisfaction levels |
| Net promoter score (NPS) | Tracks how likely customers are to recommend a brand to others on a scale of 0–10 | Measure customer loyalty and advocacy |
| Customer effort score (CES) | Measures how easy or difficult it is for customers to solve a problem or complete a task | Identify friction points |
| Customer lifetime value (CLV) | Estimates the total revenue a business can expect throughout its business relationship with a customer | Understand long-term customer value |
| Monthly active users (MAU) | Counts the number of unique users who engage with a product or platform within a month | Track product adoption |
| Average resolution time (ART) | Measures the average time it takes to resolve a customer’s issue from start to finish | Evaluate support efficiency |
| First contact resolution rate (FCR) | Tracks the percentage of customer issues resolved during the first interaction | Measure service quality |
| Customer churn and retention rates | Monitor the percentage of customers who leave or stay with a business over a given period | Track customer loyalty |
| Referral rate | Measures how often existing customers refer new customers to a brand | Assess customer advocacy |
| Response time | Captures the average time it takes a business to respond to a customer inquiry or request | Assess responsiveness |
10 Best Customer Experience Metrics to Measure Customer Experience
A positive customer experience builds loyalty, retention, and your brand’s reputation. But how do you know if your efforts are working? The answer is “measurement”.
To understand the bigger picture, you can measure customer experience in two ways:
- Directly: By asking customers for feedback through surveys.
- Indirectly: By analyzing customer behavior and operational data, such as support ticket trends.
However, experts from the Harvard Business Review and McKinsey agree that relying on a single number is a mistake. Focusing on just one metric can lead you to focus on one value rather than considering the actual customer needs. A complete view, achieved by tracking multiple metrics after mapping your customer journey, is essential to staying competitive.
While the three most common metrics are the net promoter score, customer satisfaction score, and customer effort score, they don’t tell the whole story. The following are more key CX metrics (in addition to these) to track, assess, and improve every customer interaction.
1. Customer satisfaction (CSAT)
CSAT is a transactional metric that measures a customer’s satisfaction with a specific interaction, such as a purchase, support ticket resolution, or product feature. It’s typically measured using a single-question survey: “How satisfied were you with [interaction]?” on a scale (e.g., 1–5 or 1–10).
Why it matters
CSAT provides immediate, direct feedback at specific touchpoints in the customer journey, so you can quickly identify friction points and strengths in your processes and understand exactly what works and what doesn’t.
How to calculate CSAT
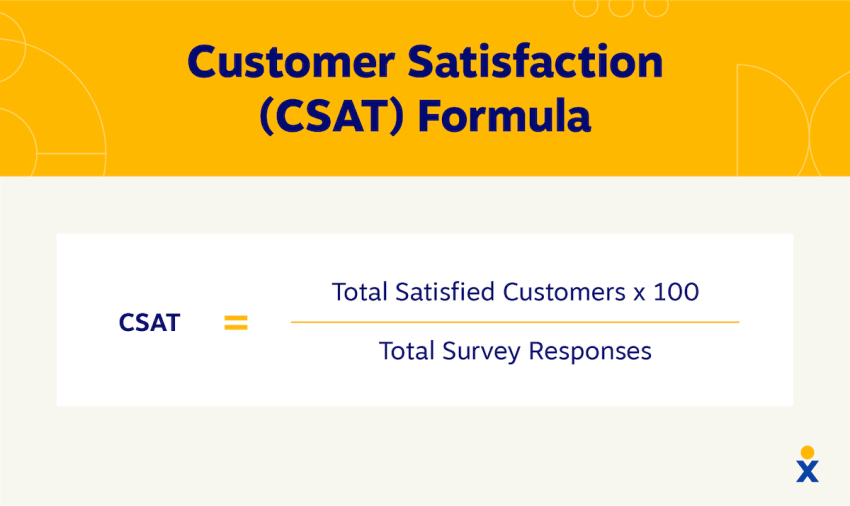
| To calculate CSAT: Ask customers to take a simple customer satisfaction survey where they rate their satisfaction on a numerical scale. Then, average those scores. CSAT = (Number of positive responses / Total number of responses) × 100 Positive responses are the top two values on the scale (e.g., 4 and 5 on a 1-5 scale). Example: An e-commerce brand sends a post-delivery survey asking, “How satisfied were you with your delivery experience?” on a scale of 1 to 5. Out of 100 responses, 80 customers rated their experience a 4 or 5. CSAT = (80 ÷ 100) × 100 = 80% |
2. Net promoter score® (NPS)
Net promoter score is a relationship metric that measures customer loyalty and the likelihood that customers will recommend your brand. It’s based on a single question: “On a scale of 0 to 10, how likely are you to recommend our company/product to a friend or colleague?”
Why it matters
NPS is a strong indicator of long-term brand health and potential for organic growth. It helps you segment your customers into three groups to tailor your engagement strategies:
- Promoters (9-10): Loyal enthusiasts who will fuel growth.
- Passives (7-8): Satisfied but unenthusiastic customers vulnerable to competitors.
- Detractors (0-6): Unhappy customers who can damage your brand.
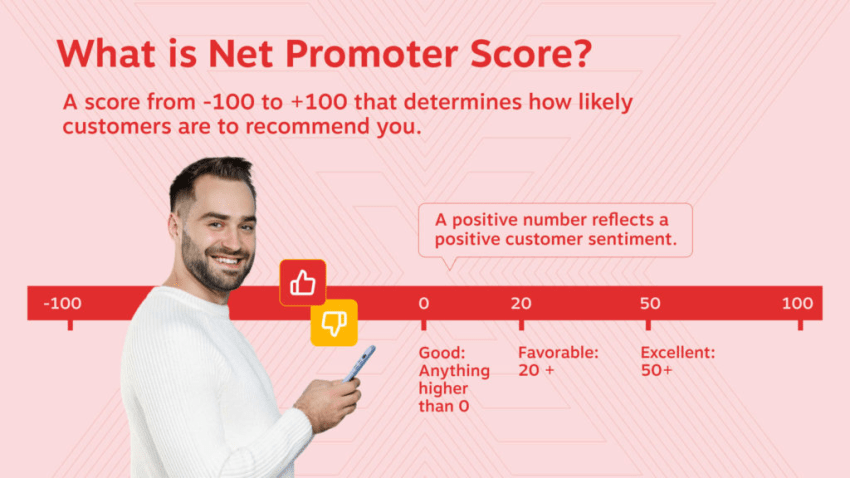
How to calculate NPS
| To calculate NPS: Subtract your percentage of detractors from your percentage of promoters. A good NPS is any score above zero, though higher numbers indicate higher scores (and fewer detractors). NPS = (% of Promoters) − (% of Detractors) Example: A company surveys 500 customers. 300 respond with a 9 or 10 (60% Promoters). 100 respond with a 7 or 8 (20% Passives). 100 respond with a 0 to 6 (20% Detractors). NPS = 60−20=40 |
3. Customer effort score (CES)
Customer effort score measures the effort a customer had to put in to resolve a problem, fulfill a request, or answer a question. The survey asks, “How easy was it to resolve your request?” on a scale of “Very difficult” to “Very easy.”
Why it matters
Customers value convenience. A hassle-free customer experience drives customer loyalty and reduces customer frustration. CES tracking helps you optimize processes, remove obstacles, and create a smoother customer journey, often resulting in lower customer churn and reduced support costs.
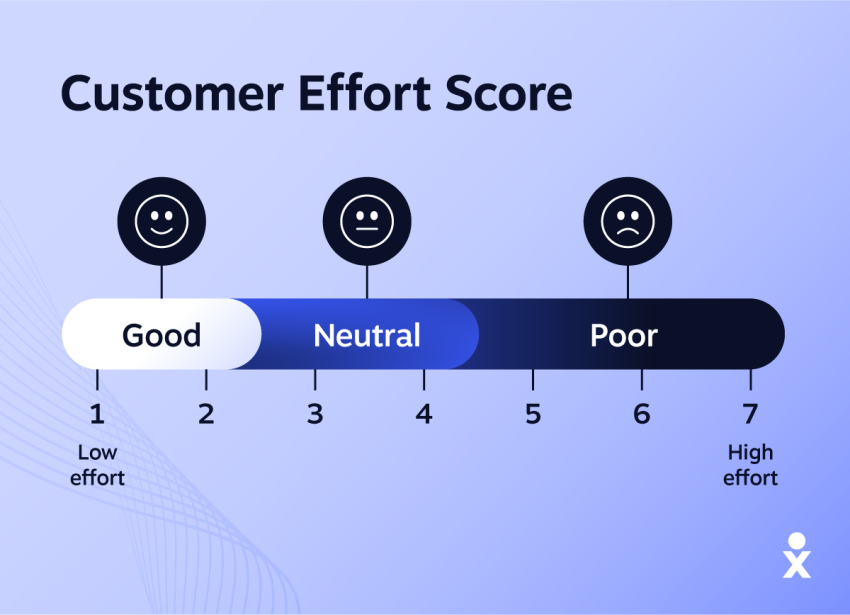
How to calculate CES
| To calculate CES: Measure this metric with surveys after a customer interaction or transaction, and average the scores. CES = (Number of “easy” or “very easy” responses / Total number of responses) × 100 Example: After a support chat, a software company asks, “How easy was it to resolve your issue today?” on a 7-point scale where 6 and 7 mean “easy”. Out of 50 responses, 35 customers rated the experience a 6 or 7. CES = (35÷50) × 100 = 70% |
4. Customer lifetime value (CLV)
Customer lifetime value is a predictive metric that forecasts the total net profit a business can expect from a single customer over the entire duration of their relationship.
Why it matters
CLV shifts the focus from short-term transactions to building long-term relationships. It helps you identify your most valuable customers, make more informed decisions about marketing spend and retention efforts, and justify investments in the customer experience that lead to sustainable profitability.
How to calculate CLV
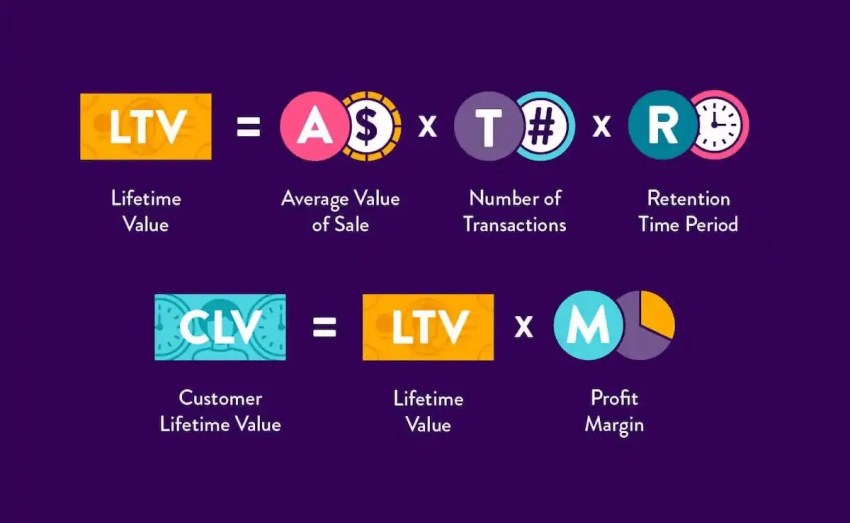
| To calculate CLV: Multiply a customer’s average purchase value by their number of purchases to find your customer value. Multiply that number by your average customer lifespan to estimate a given customer’s lifetime value. CLV = (Average Purchase Value) × (Purchase Frequency) × (Average Customer Lifespan) Example: A streaming service subscriber pays a $15 monthly fee and stays for 4 years. Average Purchase Value = $15 Purchase Frequency = 12 times per year Average Lifespan = 4 years CLV = $15 × 12 × 4 = $720 |
5. Monthly active users (MAU)
Monthly active users (MAU) counts the number of unique users who interacted with a digital product (such as a SaaS platform or mobile app) at least once within 30 days.
Why it matters
MAU is a key indicator of product quality, relevance, and customer loyalty. A rising MAU indicates successful adoption and high engagement, while a declining MAU can be an early warning sign of customer churn or reduced market relevance. It’s important for tracking the impact of new features and marketing campaigns.
How to calculate MAU
| To calculate MAU: Count the number of unique users who performed any action (e.g., login, feature use) in a given month. Example: A mobile banking app analyzes its data for June. 15,000 unique users logged in at least once during the month. The MAU for June is 15,000. |
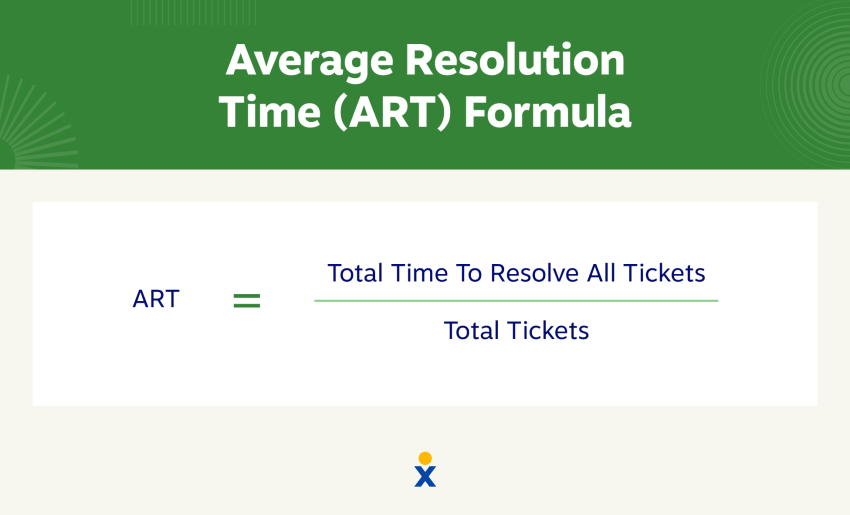
6. Average resolution time (ART)
Average resolution time (ART) is an operational CX metric that measures the average time between a customer opening a support ticket and it being marked as resolved.
Why it matters:
ART directly reflects the efficiency of your customer support team. A lower ART leads to higher customer satisfaction because issues are resolved quickly. It also helps identify bottlenecks in your support workflow and areas for employee training.
How to calculate ART
| To calculate ART: Sum up the resolution times for individual cases and divide by the total number of cases. ART= (Total resolution time for all tickets / Number of resolved tickets) Example: A support team resolves 50 tickets in one day, with a combined total resolution time of 1,200 minutes. ART = 1,200 ÷ 50 = 24 minutes |
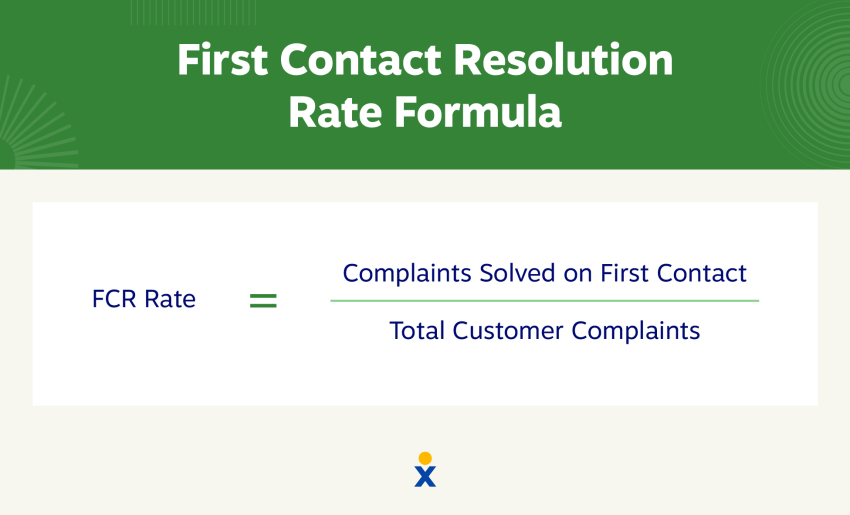
7. First contact resolution rate (FCR)
FCR is the percentage of customer support requests that are resolved on the first interaction without requiring any follow-up from the customer or the support team.
Why it matters
A high FCR shows an efficient and competent support team. It simultaneously increases customer satisfaction (by saving time and effort) and reduces operating costs (by minimizing repeat contacts and escalations).
How to calculate FCR
| To calculate FCR: Divide how many customer support cases your team resolved on the first contact by the total number of opened cases. Then multiply by 100 to get your rate. FCR = (Issues resolved on first contact / Total number of issues) × 100 Example: A contact center handles 500 customer issues in a week. 350 of those issues were resolved completely during the initial call or chat. FCR = (350 ÷ 500) × 100 = 70% |
8. Customer churn and retention rates
Churn and retention rate are two opposing metrics for measuring customer loyalty over a specific period of time.
- Churn rate: The percentage of customers who discontinue business with you.
- Customer retention rate: The percentage of customers you successfully retain.
Why they matter
These are fundamental metrics for business health. Improving customer retention is more cost-effective than acquiring new ones. Customer churn analysis helps identify and address systemic problems with your product, service, or pricing before they escalate.
How to calculate them
| To calculate customer churn rate: Divide the number of customers you lost in a given period by the number of customers you had at the beginning. Then, multiply by 100. To calculate retention: Subtract the number of customers you gained in a given period from the number of customers you had at the end. Then, divide that by the number of customers you had at the beginning of the period. Multiply that number by 100 to get your retention rate. Churn rate = (Customers lost in period / Customers at start of period) × 100 Retention rate = ((Customers at end−New customers) / Customers at start ) × 100 Example: A subscription service starts Q1 with 1,000 customers. During Q1, it loses 100 customers but gains 150 new ones, ending with 1,050. Churn rate = (100÷1,000) × 100 = 10% Retention rate = ((1,050−150) ÷ 1,000) × 100 = 90% |
9. Referral rate
Referral rate is the percentage of all customers who successfully refer at least one new customer through a trackable referral program within a given period.
Why it matters
Referrals are growth drivers, bringing in valuable customers at low acquisition costs. The referral rate reflects high customer satisfaction and trust. Customers referred by existing customers have higher CLV and are more loyal.
How to calculate referral rate
| To calculate customer referral rate: Your referral rate is the number of customers who referred your business divided by your total customer count, multiplied by 100. Referral rate = (Number of customers who made a referral / Total number of customers) × 100 Example: An online retailer has a customer base of 20,000. In the last quarter, 400 of those customers successfully referred a friend through the referral program. Referral rate = (400 ÷ 20,000) × 100 = 2% |
10. Average first response time
Average first response time is the average time it takes a support agent to provide an initial response to a customer inquiry. This differs from time to resolution (ART), which measures the total time to resolution, not just the first response.
Why it matters
In an on-demand world, speed is critical. A quick initial response acknowledges the customer’s problem and reassures them that help is on the way. This can reduce anxiety and increase satisfaction, even if the final resolution takes longer.
How to calculate average first response time
| To calculate average response time: Sum up the response times for all customer inquiries and divide by the total number of cases. Average first response time = (Total time to first response for all tickets / Number of tickets) Example: A support desk received 100 emails in a day. The total time taken to send the first reply to all of them was 500 minutes. Average first response time = 500 ÷ 100 = 5 minutes |
4-Step Framework for Measuring CX
Measuring customer experience doesn’t have to be complex. Follow this simple framework to get the most out of your customer experience:
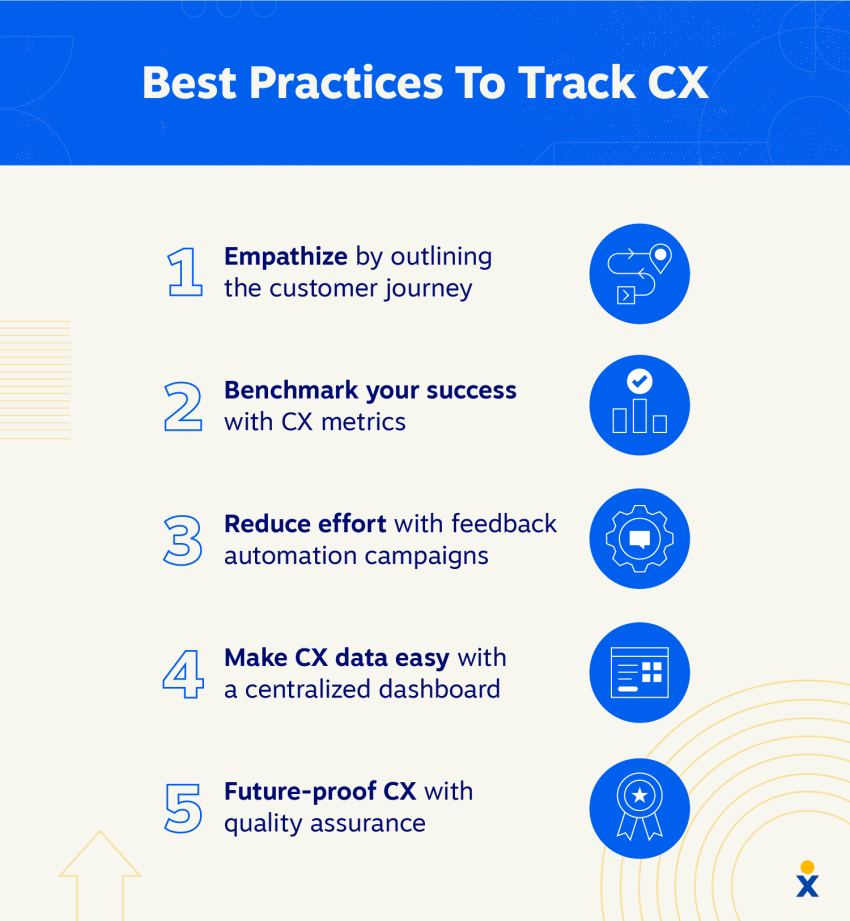
1. Define your goal and map the journey
Start by setting a clear, measurable objective, like “reduce customer churn by 5%.” Then, focus on one critical customer journey that impacts this goal, such as product onboarding or resolving a support issue. Identifying the key touchpoints within that journey is the fastest way to find pain points and achieve a quick win.
2. Assign a mix of metrics to each touchpoint
For each touchpoint, assign relevant calling metrics. The best insights come from combining quantitative data (the “what,” like CSAT scores) with qualitative feedback (the “why,” like open-ended survey comments). This gives you a complete picture of performance.
3. Automate feedback collection
Use automation to ask for feedback at the right time and on the customer’s preferred channel. To get the full picture, supplement direct surveys with indirect data from product usage analytics and support trends. This provides timely insights without manual effort.
4. Centralize, analyze, and act
Bring all your CX metrics into a single dashboard for a unified view. Go beyond just monitoring the data by segmenting it by customer personas to uncover deeper insights. Most importantly, use these findings to adapt your strategy and drive continuous, meaningful improvement in the customer experience.

Nextiva Makes Your CX Data Easier to Analyze
When it comes to measuring customer experience, simpler is often better.
Instead of drowning in CX metrics, prioritize a single journey, understand the in-journey signals to watch out for, and bring it all together in a single dashboard like Nextiva.
The more unified your data, communications, and software are, the easier it is to create meaningful and enjoyable customer relationships.
The call center solution teams love.
Sales and support teams use Nextiva to deliver a better customer experience.
Net Promoter, Net Promoter Score, and NPS are registered trademarks of Satmetrix Systems, Inc., Bain & Company, Inc., and Fred Reichheld.
How to Measure Customer Experience FAQs
While every business has unique needs, most successful programs are built on three foundational metrics:
Net promoter score (NPS): Measures long-term customer loyalty.
Customer satisfaction (CSAT): Measures short-term happiness with a specific interaction.
Customer effort score (CES): Measures how easy it was for a customer to resolve an issue.
Benchmarks vary by industry, but here are some general guidelines:
NPS: A score above 0 is good, over +50 is excellent, and over +70 is world-class.
CSAT: This is a percentage score, where 80% or higher is typically considered a great score.
CES: The goal is to make things easy, so a high score is best. The most important thing is to track your own score and work to improve it consistently.
Collecting data is the first step. The most critical part is “closing the loop.”
For negative feedback: Follow up with unhappy customers to resolve their issue. This can often turn a detractor into a loyal advocate.
For positive feedback: Thank your promoters and empower them to share their experience through reviews or referrals.
For all feedback: Analyze trends to identify and fix the root cause of recurring problems.
For a call center, you need to blend performance metrics with customer perception metrics:
Performance metrics: Track first contact resolution (FCR) to see how many issues are solved on the first try and average resolution time (ART) to measure efficiency.
Perception metrics: Send a short CSAT or CES survey immediately after a call or chat to link your team’s performance directly to the customer’s experience.


