 Customer Experience
  Blog
Blog  Business Communication
  Leadership
  Marketing & Sales
  Productivity
  VoIP
VoIP 


For most companies, contact centers are an extension of the business. As such, the need to measure and improve call center performance is critical.
95% of companies say measuring call center metrics is important for improving customer satisfaction. But which key performance indicators (KPIs) should you track?
With over 100 potential call center metrics to choose from, it’s essential to identify and focus on the vital few KPIs that offer the greatest insight and pinpoint areas for improvement.
We’ll walk you through 12 key call center metrics to focus on and how to use the data to improve performance and processes that boost productivity, efficiency, and the overall customer experience.
What Are Call Center Metrics?
Call center metrics are standard measurements used to assess the performance of a contact center. In many cases, businesses use call center analytics platforms to track these data.
These metrics may be used by call center managers to look for ways to improve the customer experience and agent efficiency. Over time, these metrics have evolved to keep pace with call center industry trends and customer feedback.
Why It’s Necessary To Track Call Center Metrics
Contact center metrics provide insight into key performance indicators (KPIs) like first contact resolution, peak hours, call lengths, first response time, repeat calls, and total time spent on customer queries across workflows and channels like phone, email, chat, social media and more over a period of time.
Tracking metrics is a best practice for call centers.
Since call centers act as the voice of their client’s brands in many customer interactions, these metrics offer vital insights. By regularly monitoring metrics, you can spot potential issues that may lead to poor customer experiences and high churn rates.
Tracking metrics over time helps you catch emerging trends early so you can resolve issues promptly or optimize processes that are working well. Quick action ensures customers have the best possible experience, making them more likely to remain loyal to the brand.
Regularly analyzing call center metrics, identifying shifts, and taking corrective action is crucial for maintaining high customer satisfaction.
Tracking performance through properly selected KPIs provides the visibility needed to continuously refine operations. This focus on metrics enables call centers to better serve their customers.
Related: Contact Center Optimization: How to Run a Smoother Contact Center
Top Call Center KPIs and Metrics To Monitor

Here, we’ve rounded up 12 call center metrics businesses need to track. They fall under three categories:
Customer experience metrics
Customer experience metrics help you assess the ease of getting help from your company and the resulting customer satisfaction.
Get the State of CX Report
All of our customer experience insights and tips on developing your CX strategy, right in your inbox.
These metrics are essential because high scores indicate satisfied customers who are less likely to churn. Use these call center KPIs to look for opportunities to improve the customer journey:
1. Net Promoter Score (NPS®)
The Net Promoter Score (NPS) is a powerful metric used to gauge customer loyalty and satisfaction. At its core, it asks the customers the following question:
“On a scale of 0-10, how likely are you to recommend our company to your friends and peers?”
Customers respond with a score ranging from 0 (not at all likely) to 10 (extremely likely). Based on their scores, customers are categorized into three groups:
- Promoters (score 9-10) — Loyal enthusiasts who will promote your company to others.
- Passives (score 7-8) — Satisfied but unenthusiastic customers.
- Detractors (score 0-6) — Unhappy customers who can damage your brand through negative word-of-mouth.
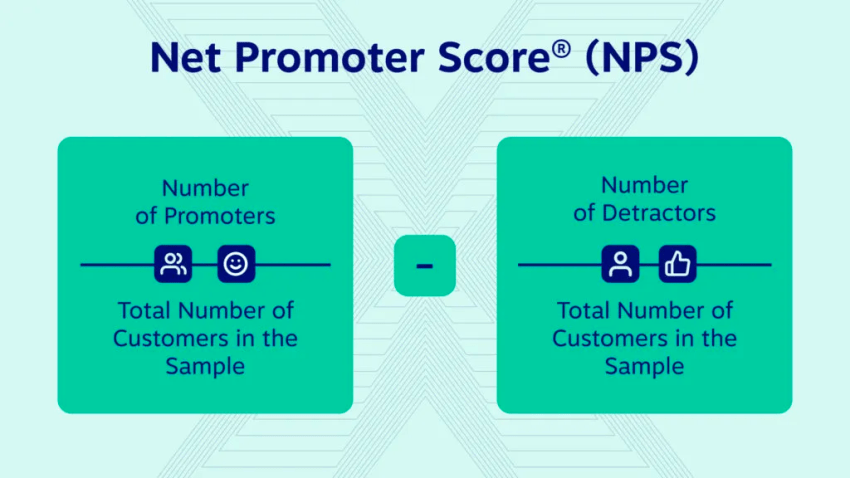
The Net Promoter Score is calculated by subtracting the percentage of Detractors from the percentage of Promoters.
Formula: (Number of Promoters ÷ Total Number of Customers in the Sample) − (Number of Detractors ÷ Total Number of Customers in the Sample)
For example:
- Percentage of Promoters: 80%
- Percentage of Detractors: 20%
NPS = Percentage of Promoters – Percentage of Detractors = 80% – 20% = 60
The higher the NPS (maximum is 100), the more loyal and enthusiastic your customer base is. The score provides actionable data — you can study what your Promoters love and what’s causing your Detractors to be unhappy. Over time, an improving NPS signals greater customer loyalty and advocacy for your brand.
2. Customer Satisfaction (CSAT)
The Customer Satisfaction Score (CSAT) provides insight into the average customer experience and satisfaction rates with your customer support or services. Consider this metric a key component of your quality assurance system.
Companies typically ask customers for feedback on whether a customer service agent or interaction has adequately solved an issue or met the customer’s needs. CSAT scores offer the most direct way to gauge the customer’s perception of the support experience received.
Based on a scoring system, companies categorize responses into sentiments such as:
- Very satisfied
- Satisfied
- Not satisfied
- Very dissatisfied
The CSAT is calculated using the following formula:
Formula: (Number of Satisfied Customers / Total Number of Survey Respondents)
The final CSAT score is expressed as the ratio of “very satisfied” and “satisfied” responses to the total number of survey respondents.
Tracking CSAT over time provides visibility into customer satisfaction trends. It enables companies to identify areas of strong performance to continue supporting, as well as potential areas for improvement in customer experiences and interactions.
The higher your CSAT score, the better the customer experience being delivered by your organization.
3. First Call Resolution (FCR)
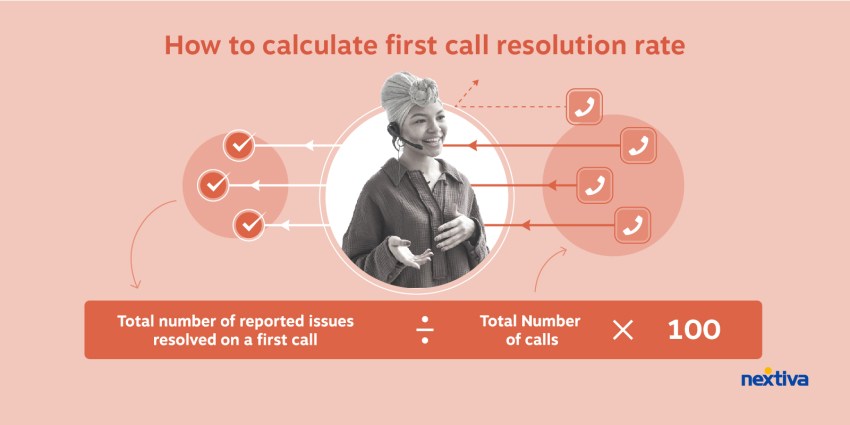
The First Call Resolution (FCR) rate measures your call center’s ability to resolve customer issues within the first contact, whether by phone, email, chat, or other channels.
Formula: FCR = (Total Issues Resolved on First Contact ÷ Total Number of First Contacts) x 100
A higher FCR demonstrates excellent call/contact quality – with agents able to quickly understand, troubleshoot, and address customer needs. This creates a seamless and satisfactory experience for the customer without the frustration of callbacks or transfers.
Tracking FCR helps assess:
- Call center success at issue resolution
- Individual agent performance and efficiency
- Areas for improvement through targeted coaching and training
Analyzing interactions that required multiple contacts prior to resolution helps organizations identify the root causes and build action plans to fill gaps.
An increasing FCR rate signals positive momentum for the customer experience and call center operations overall.
Some industry benchmarks range between 70-85%, with the top call centers exceeding 90% first call resolution rate.


4. Customer Effort Score (CES)
The Customer Effort Score (CES) measures how much effort a customer had to exert to get an issue resolved by your customer support team. While there is no standard CES measurement system, many companies use a 5 or 7-point scale.
The CES relies on asking customers a single question after the service interaction, such as:
“On a scale of 1-7, where 7 means strongly agree and 1 means strongly disagree, to what extent do you agree with the following statement: The service I received made it easy to handle my issue.”
The higher the CES, the less effort a customer had to expend to get their issue resolved, indicating superior service quality and ease of getting support.
Companies track CES trends over time as a key indicator of customer experience. Low and declining CES signals customer frustration and lost productivity in getting issues handled.
As an actionable customer experience metric, improving CES points to areas where self-service tools or agent training can better assist customers. Leading companies aim for high and rising CES scores, demonstrating seamless support experiences for their customers.
Agent performance metrics
Improving individual call center agent performance is a common call center strategy. When you’re fully leveraging each staffing asset, your entire organization becomes more productive and efficient.
These are the agent performance metrics that you should monitor:
5. Agent Utilization Rate
The Agent Utilization Rate measures the percentage of logged-in time call center agents spend actively handling customer contacts during a given time period.
Formula: Agent Utilization Rate (%) = (Total Handled Call Time / Total Logged In Time) x 100
Handled call time includes talk time, hold time, and after-call work. Logged-in time is the total hours agents are clocked in and available to take contacts during a scheduled shift.
A utilization rate of 75-90% is generally considered a best practice target for contact centers. This allows agents adequate time between calls for a break, personal time, and catching up on administrative tasks.
Tracking utilization rates enables better workforce management, including:
- Identifying top-performing agents who handle contacts efficiently
- Determining training needs to improve slower-performing agents
- Right-sizing staffing schedules to match call volumes
- Monitoring individual and team adherence to schedules
High utilization signals agents spending maximum time on revenue-generating activities.
Yet ultra-high rates approaching 100% allow little flexibility between contacts, risking longer handle times and agent burnout over time. An optimal rate balances customer experience, revenue generation, and agent engagement.
Related: 18 Customer Engagement Metrics Businesses Need To Benchmark
6. Occupancy Rate
The Occupancy Rate measures the percentage of logged-in time that call center agents spend actively handling customer contacts versus being available but idle.
Formula: Occupancy Rate (%) = (Total Handling Time / Total Logged In Time) x 100
A target Occupancy Rate range is 75-85%. Rates below 70% may signal inefficiencies with agents having excessive idle time between contacts. This could limit revenue potential and agent productivity.
Low Occupancy Rates can guide management decisions on:
- Condensing schedules during slower periods
- Reducing time for breaks, meetings, etc.
- Identifying non-call related tasks that could be assigned elsewhere
- Coaching agents on best practices for contact handling
Monitoring Occupancy Rates ensures schedules and staffing are aligned with contact volumes to optimize customer service and operational efficiency.
Higher rates correlate strongly with first-call resolution rates and positive customer satisfaction.

7. Average Speed of Answer (ASA)
The Average Speed of Answer (ASA) measures the average time it takes for a call to be answered by a live agent in a call center. It assesses call center responsiveness and service quality from the customer’s perspective.
Formula: ASA = Total wait time of all answered calls / Total number of answered calls
Many call centers establish an ASA goal or target threshold, such as answering calls within 60 seconds. This internal benchmark is based on industry standards and customer service expectations.
Tracking ASA over periods of high and low call volumes indicates whether service level goals are being met consistently. If ASA rises, it signals lower productivity, insufficient staffing, or the need for efficiency improvements.
Combining ASA trends with customer satisfaction scores provides insight into the impact of waiting times on the overall state of customer experience.
Maintaining a low and consistent ASA demonstrates excellent inbound response rates and alignment between customer expectations and service capacity. It’s a key quantitative metric focused specifically on call center speed and productivity.
8. Average Handle Time (AHT)
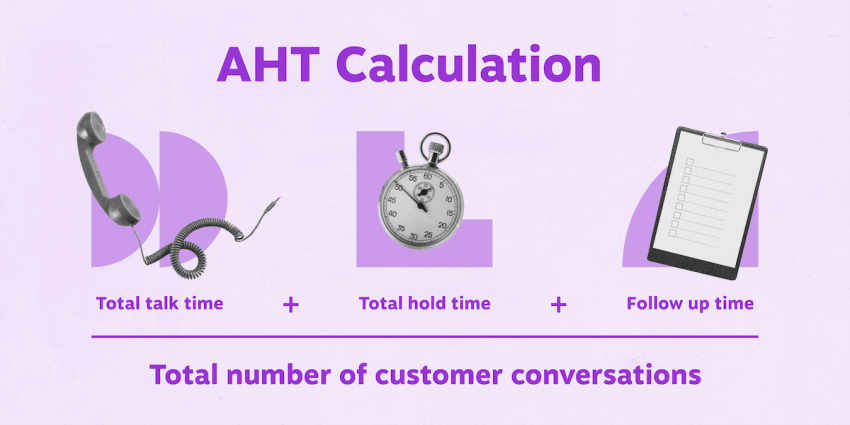
The Average Handle Time (AHT) measures the average amount of time call center agents take to handle customer calls from start to finish, including hold times and after-call administrative tasks.
Formula: AHT = (Total Talk Time + Total Hold Time + Total After Call Work Time) / Total Calls Handled
Tracking AHT helps call center managers:
- Set performance benchmarks for individuals and teams
- Identify agents who may need additional training, coaching, or system support to improve efficiency
- Right-size staffing needs and schedules based on call volumes and complexity
Analyzing trends in handle times, including fluctuations between the average, shortest, and longest calls, provides data to enhance customer service, agent productivity, and call resolution rates.
The target is to balance optimal AHTs and first-call resolution, ensuring customer issues are solved without sacrificing quality by rushing calls.
Low AHTs may indicate agents closing calls prematurely without confirming issue resolution.
An overly high AHT could signal inefficiencies in processes or agent skills. Driving continual AHT improvements ensures customers get quick yet thorough support.

Call center performance metrics
Call center performance metrics track the performance of your contact center overall within a given period. Improving your call center performance metrics may reduce costs, increase profits, and enable you to deliver stronger results for your clients.
9. Cost Per Call (CPC)
The Cost Per Call (CPC) metric measures the average cost incurred by a call center to handle each phone call. Tracking CPC over time shows the financial efficiency of contact center operations and can be used for capacity planning and budgeting.
Formula: CPC = Total Cost of Call Center Operations / Total Calls Handled
The total cost of call center operations includes:
- Staffing expenses (agent salaries + benefits)
- Telecommunication fees
- Technology costs
- Facility overhead expenses
A lower CPC indicates higher contact center productivity and financial efficiency. Companies often establish a target CPC threshold and monitor actual monthly/quarterly performance against that goal to control budgets.
If CPC rises above the set target, call center managers can dig deeper to analyze root causes:
- Are agent labor costs increasing disproportionately?
- Is call handle time rising?
- Are technology investments paying off as planned?
Continuous monitoring of CPC ensures contact center resources are allocated optimally for service quality and cost efficiency. When paired with customer satisfaction scores, CPC also shows the ROI of customer experience investments.

10. Service Level
The Service Level is a key performance indicator measuring a call center’s ability to efficiently meet inbound demand. Specifically, it assesses the percentage of calls answered by agents within a defined threshold time.
A common Service Level target is 80% of calls answered in 20 seconds or less. Companies determine their target based on factors such as customer expectations, cost efficiency, and service quality goals.
Formula: Service Level (%) = (Calls Answered in X seconds or less / Total Inbound Calls) x 100
Tracking Service Level performance over time and against internal targets enables assessment of operational efficiency, capacity planning, and adherence to customer service standards.
If the Service Level drops below the goal consistently, it signals a need to adjust resources, agent scheduling, or inbound demand flows.
Call centers strive to maintain a high Service Level to limit customer wait times, prevent call abandonment, and meet customer service benchmarks.
Optimizing processes around skills-based routing, cross-training, and peak staffing helps balance cost efficiency with service quality targets reflected in the Service Level metric. Most leading call centers target 80-90%+ on Service Level to enable prompt response times.
11. Call Volume
Call Volume measures the total number of inbound and outbound calls handled by a call center over a defined period (e.g. daily, weekly, monthly).
Formula: Total Call Volume = Number of Agent Calls + Number of Self-Service Calls
Call volume is typically segmented into two main categories for analysis:
- Agent Calls — Total calls handled directly by live agents
- Self-Service Calls — Total calls handled by an automated system such as an Interactive Voice Response (IVR) system.
Tracking overall and segmented call volume over time provides insight into:
- Changes in contact center activity and demand
- Effectiveness of self-service tools in deflecting calls from live agents
- Scheduling and staffing requirements to meet customer demand
- Identifying peak and low volume periods
Analyzing trends in call volume and origin points helps call centers stay aligned with customer needs and size operations appropriately.
When paired with other metrics like Average Handling Time and Service Level, call volume paints a picture of contact center efficiency and resource allocation.
12. Call Abandonment Rate
The Abandon Rate measures the percentage of calls into a call center that disconnect (“abandon”) before being answered by a live agent.
Formula: Abandon Rate (%) = (Number of Abandoned Calls ÷ Total Number of Call Attempts) x 100
Customers typically expect fast service and have limited tolerance for long hold times. A high and rising abandon rate signals customer frustration, potential loss of business, and damage to your brand’s reputation.
By tracking abandon rates over time and setting internal benchmarks (ideally less than 3-5%), call centers can quantify the impact of operational changes and identify periods of inadequate staffing.
Common strategies to reduce abandon rates focus on optimizing interactive voice response (IVR) menus, boosting agent staffing during peak periods, and keeping callers informed if delays are expected. Lowering your abandon rate leads to better customer retention over the long term.
Setting a target for abandon rates and analyzing performance trends versus that goal keeps supervisors aligned around providing sufficient resources to meet inbound demand. This real-time metric serves as an early warning signal when additional agents are needed to keep customers from disconnecting prematurely.

How To Improve Call Center Metrics
Monitoring your call center metrics is the first step. Knowing how to leverage that data to improve contact center performance is the next.
These call center strategies can help you improve call center metrics and performance:
1. Set realistic and achievable goals based on metrics
Setting realistic and achievable goals requires analyzing historical data to identify trends and patterns.
Use metrics like call volume, handle time, and customer satisfaction to set realistic targets that align with business objectives.
Goals should stretch teams but also instill confidence. Regularly reviewing progress ensures goals adapt to changing needs.
2. Use data to identify areas for improvement
Using data to identify improvement opportunities takes consistency in what is measured and how it is monitored. Key metrics like first call resolution, transfer rate, and call abandonment should be tracked in real-time dashboards.
Slicing data by agent, region, and call type helps identify specific areas for training or adjustment. Setting data-driven goals and openly discussing progress builds an improvement culture.

3. Track your progress over time
Plenty can change in your organization, including call center strategies, agent scripts, and even staffing policies. Evaluate your progress over time, considering these changes to determine what’s helping (and what isn’t). Tools such as Nextiva Call Analytics can help you monitor all your call center KPIs.
4. Conduct agent training and coaching based on metrics
Effective agent training and coaching are impossible without metrics.
Key indicators like customer effort score, net promoter score, and quality audit performance provide objective insights into individual development areas.
Assess evaluations, surveys, and quality assurance trends over time for each agent to create targeted and personalized training and coaching that drive continuous skill improvement.
Related: Call Center Performance Management Methods for Agent Success
5. Use technology to optimize call center performance
Technology is essential for optimizing call center performance.
Metrics-driven routing engines efficiently match customers and available agents and real-time customer sentiment analysis facilitates agent coaching.
Evaluate how technology innovations impact key metrics like customer satisfaction and cost per call to identify the highest return solutions.
Customers also want to interact with businesses using their preferred communication methods. Choosing call center phone systems that include options for SMS messaging and even video conferencing can deliver customer excellence as a result.

Related: 101 Call Center Abbreviations, Acronyms, and Definitions
Choose the Right Solution To Make Tracking Easy
Call center monitoring is critical to evaluate everything from the quality of customer support to agent productivity and efficiency.
The right call center technology can help, especially if it has a built-in analytics offering.
Nextiva’s call center solutions come with an analytics add-on that offers the following:
- Performance metrics, including total calls, total talk time, and total number of inbound calls
- Reporting templates to measure activity across your organization, including for individual employees
- Call reporting metrics, including the number of answered calls compared to the number of missed or abandoned calls or incoming calls vs. outbound calls
Our analytics are fully integrated with our virtual call center software, allowing you to collect data in real time while your team works hard to deliver outstanding customer support. Nextiva also integrates with popular CRMs, streamlining data synching across multiple platforms.
Knowing which KPIs to track — and what your call center’s standard benchmarks are — ensures that you’re delivering the best customer experience possible.
Related: Omnichannel Customer Experience: The Complete Guide
Track the essential contact center KPIs to optimize performance.
Book a demo of our analytics software here.