
 Customer Experience
  Blog
Blog  Business Communication
  Leadership
  Marketing & Sales
  Productivity
  VoIP
VoIP 


Businesses are investing heavily in customer experience (CX), whether that’s expanding channels, adopting AI, or personalizing customer support interactions. According to the annual Nextiva CX Trends report, 96% of leaders believe CX delivers strong returns. Nearly half (47%) also note that CX investments are valued because their ‘impact’ can be measured.
One of the best ways to do that is by tracking customer engagement metrics and key performance indicators (KPIS), especially as more companies bring AI into the mix.
With AI-powered customer engagement, the playbook is still being written, leaving many organizations uncertain about AI’s actual impact on customer experience. Customer engagement data can bridge this knowledge gap, giving you those answers and a lot more.
In this article, we cover 14 key customer engagement metrics that can strengthen your CX strategy.
Why You Need to Track Customer Engagement Metrics
Learning how to measure customer engagement sets your business up for success by giving you clear, actionable insights into your CX efforts. They show what’s working, what’s not, and the impact of your CX efforts on both customers and business results.
- Set a clear benchmark and direction: Instead of vague goals like “improve customer satisfaction,” you can set specific targets like “reduce repeat tickets by 25%” or “increase feature adoption post-support by 60%.”
- Quantify customer engagement: You get specific numbers that prove whether your CX strategy actually moved the needle. For example, instead of assuming customers are happy with your support, you have data (like a 4.5 CSAT score) to prove it.
- Understand if strategies are working: When you introduce new macros, adjust escalation processes, or launch an AI agent, engagement metrics show whether customers who received that type of help are more satisfied.
- Demonstrate CX value to leadership: Instead of reporting “resolved 5000 tickets this month,” you can show that the customers you helped increased product usage by 35% or had 40% fewer follow-up issues, proving you drive real business results.
- Improve the customer journey: Customer engagement metrics show you how support interactions and customer behaviors affect CX. For example, you might discover that customers who get help during onboarding become more invested in your brand or services.
- Boost employee motivation: Teams perform better when they can see how their work directly impacts customer satisfaction and business results. This is also why companies use customer engagement metrics for leaderboards and gamification.
When customers use your app less, open fewer emails, or visit your website less often, it often signals weakening loyalty.
By measuring customer engagement analytics across all touchpoints, you can spot at-risk customers and contact them personally, helping reduce churn.


1. Customer Satisfaction Score (CSAT)
A CSAT is like a quick pulse check on how happy your customers are with your company, product, or service. It’s their chance to tell you what they really think, right after an important interaction like making a purchase or getting help from your support team. It also provides insight into support reps that may need coaching and which customer support channels are underperforming.
When used correctly, CSAT goes beyond surface-level vanity metrics. Tracking customer satisfaction by channel, agent, or service gives you deeper, more valuable insights. This can be which support reps need coaching, which channels are underperforming, or which products or services create friction that brings down the overall satisfaction scores.
How do you measure CSAT?
You can measure customer satisfaction through direct customer feedback. Customers rate their experience on a 1-to-5 scale in response to a question like: “How was your experience?” We suggest adding an open-ended question after the scale. This will help you understand the “why” behind the score.
- Very unsatisfied
- Unsatisfied
- Neutral
- Satisfied
- Very satisfied
Once you get the rating, the next step is calculating the average CSAT score. For this, you use the following formula:
| (Number of satisfied customers (4 and 5) / Number of survey responses) x 100 = % of satisfied customers |
For example, if 40 out of 50 are positive responses, your customer satisfaction score is 80%.
While a CSAT score of 75-85% is considered good, the ideal score depends on your industry and specific goals.
We often focus on negative customer engagement scores, but a quicker way to improve is to focus on the neutral ones. These customers aren’t angry or unhappy, just underwhelmed. Small changes, such as clearer instructions, faster responses, or a smoother experience, can turn them into satisfied customers and boost your CSAT score.
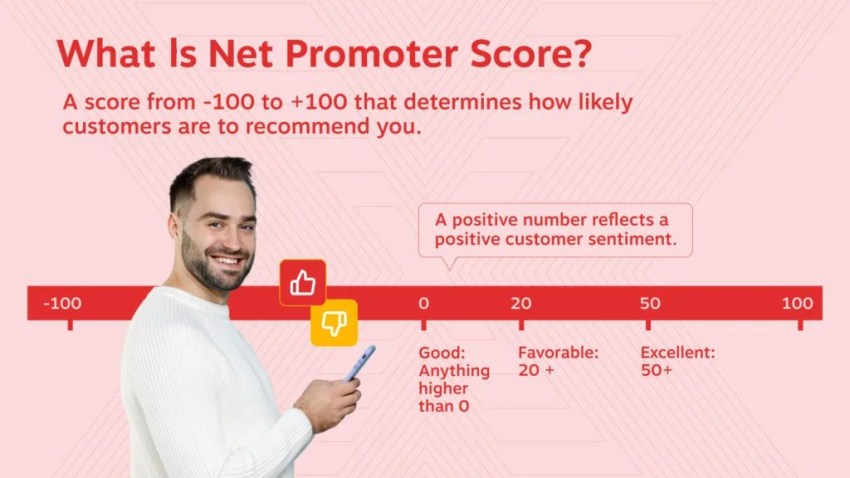
2. Net Promoter Score® (NPS)
Another key metric for customer engagement, NPS, is all about loyalty and whether your customers like you enough to recommend you to others. Customers give you a score based on how likely they are to spread the good word, which helps you predict how your business can grow.
NPS goes deeper than CSAT because it asks customers whether they would put their reputation on the line to recommend your brand to others. And this willingness to promote your brand provides a true measure of customer loyalty.
High NPS scores usually mean happy customers who stick around and attract new ones. It also helps you identify your most loyal customers (your “promoters”) who can become valuable advocates for your brand. If your NPS is low, it’s a signal to dig deeper and figure out what’s holding customers back.
How do you measure NPS?
First, you ask customers the question, “On a scale of 0-10, how likely are you to recommend [company/product/service] to a friend or colleague?”
Customers respond on an 11-point scale from 0 (not at all likely) to 10 (extremely likely).
- Promoters (Scores 9-10): Enthusiastic customers, highly likely to recommend your brand.
- Passives (Scores 7-8): Satisfied but not overly enthusiastic.
- Detractors (Scores 0-6): Unhappy and unlikely to recommend your brand.
NPS is calculated by subtracting the percentage of Detractors from the percentage of Promoters.
| % Promoters – % Detractors = NPS |
For example, if 50% of your survey respondents are Promoters and 10% are Detractors, your NPS is 40.
NPS benchmarks
- Above 0: Considered good, indicating more Promoters than Detractors.
- Above 20: Excellent, showing a strong level of customer advocacy.
- Above 50: World-class, demonstrating exceptional customer loyalty.
Ask a representative segment of your customer base to establish your starting point before rolling out company-wide NPS surveys. By comparing these results to industry benchmarks, you can set realistic improvement targets.
3. Customer Effort Score (CES)
Nobody likes to jump through hoops to get things done, and that includes your customers. CES measures how easy it is for them to interact with your company and solve their problems.
While CSAT and NPS measure satisfaction or loyalty, CES focuses on friction. It asks customers how easy or difficult it was to do something. This is usually getting in touch with your support team or performing a particular task.
By identifying exactly where customers struggle, you can fix those pain points and simplify the processes that cause frustration. When customers report high effort scores, it says they’re frustrated, while low effort scores show they’re happy with their experience.
How do you measure CES?
CES is typically measured by asking customers to rate how easy it was to complete a specific task, like resolving an issue or finding information.
The survey question usually appears immediately after an interaction: How easy was it to do [the action]?
Here’s the formula to calculate the score:
| The sum of CES ratings ÷ Number of survey responses = CES |
CES benchmark: For a five-point scale, scores of 1 or 2 are considered good. For a seven-point scale, scores of 1 to 3 are considered good.
Send CES surveys right after a specific interaction, while the experience is fresh in the customer’s mind. This means they don’t rate you based on vague memories. And if you add an open-ended question here, you also get context on what exact friction point you need to fix to get a lower CES score.

4. Conversion Rate
Conversion rate measures the percentage of people who take a desired action out of everyone who had the chance. This could be:
- Website visitors making a purchase
- Email recipients clicking a link
- Trial users becoming paying customers
And more.
How do you measure conversion rate?
The formula for calculating conversion rates is simple:
| (Number of conversions ÷ Total number of opportunities) × 100 = Conversion rate |
You can calculate the conversion rate for each stage of the customer journey. For example:
- If 5,000 people click your Facebook ad but only 1,000 start your free trial, that’s a 20% ad-to-trial conversion rate
- If 1,000 people start your free trial but only 150 become paying customers, that’s a 15% trial-to-paid conversion rate
- If 500 paying customers are eligible for upgrades but only 75 actually upgrade, that’s a 15% upgrade conversion rate
- If 200 customers come up for renewal but only 160 actually renew, that’s an 80% renewal conversion rate
This way, you can optimize each stage of the digital customer journey.
Track both micro- and macro-conversions. Micro-conversions, like email signups or content downloads, show customer interest and feed the pipeline. Macro-conversions, like purchases, drive revenue. Improving micro-conversions at early stages of the funnel often boosts macro-conversions down the line.
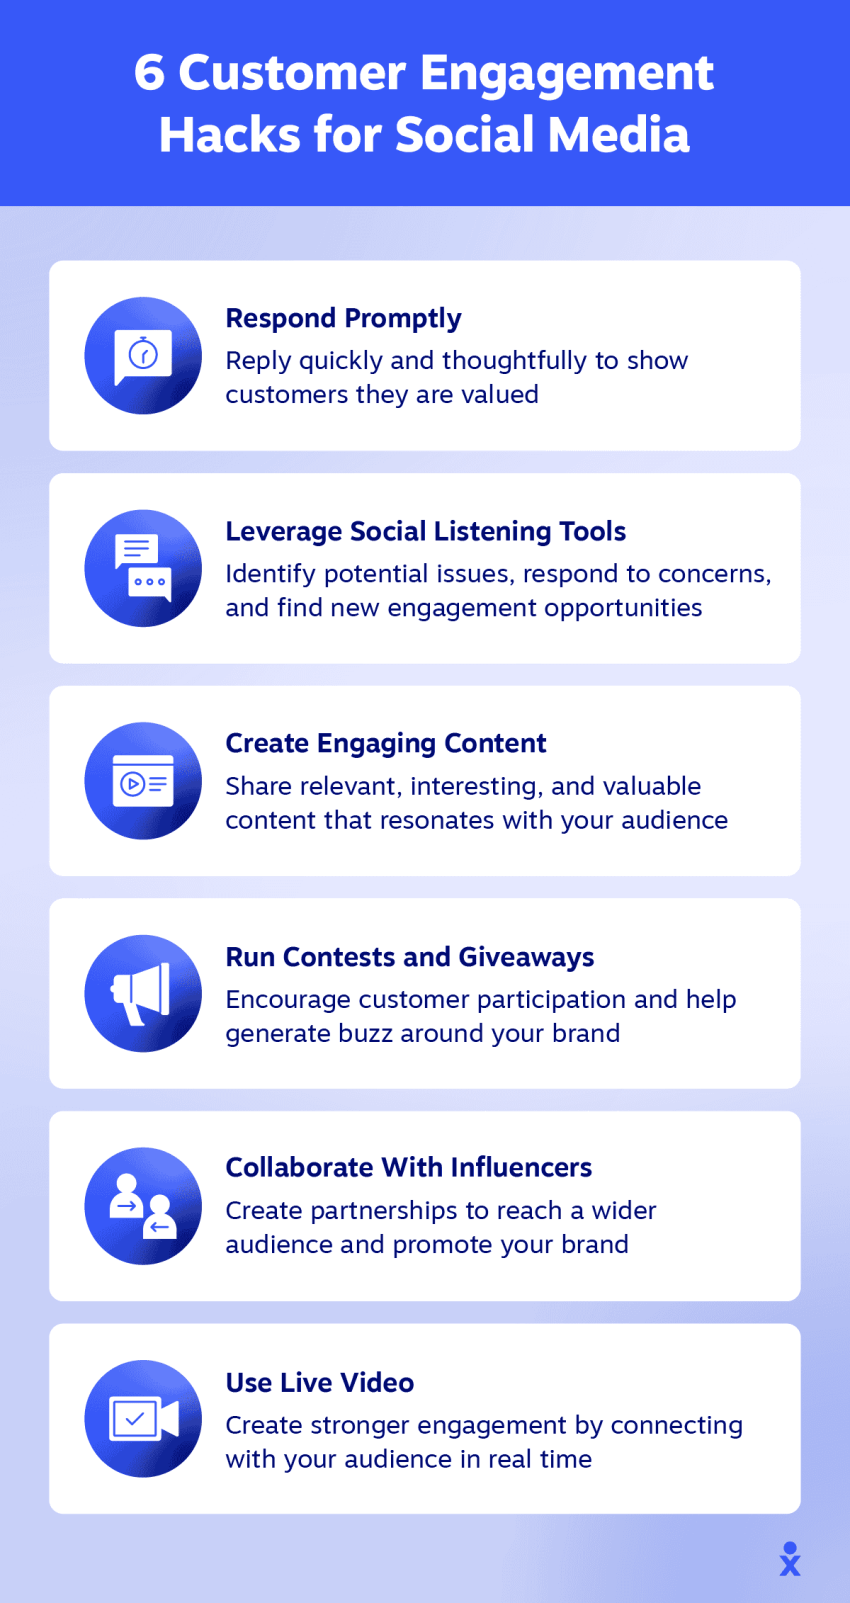
5. Social Media Engagement
Social media is another great KPI for customer engagement. Social media engagement shows how much people interact with your content, whether that’s liking, sharing, or commenting, across all your social media platforms.
Monitoring social media lets you hear what people say about your company, manage your online reputation, spot potential problems, and find your advocates.
Key customer engagement metrics for social media:
- Brand mentions: Track how often your brand is mentioned online, both directly (@mentions) and indirectly (in general conversations to understand the volume and context of conversations related to your brand.
- Sentiment analysis: Analyze the tone and emotion behind social media mentions to gauge overall brand sentiment. Are people expressing positive, negative, or neutral opinions about your company?
- Reach: Measure the potential audience exposed to your brand mentions and social media content, indicating how far your message is spreading.
- Share of Voice: Compare your brand mentions to those of competitors to understand your brand’s prominence in online conversations.
- Trending topics: Stay informed about trending topics and hashtags related to your industry and brand to identify opportunities to join relevant conversations and engage with your audience.
How do you measure social media engagement?
To start, you use social media management or brand monitoring tools to track your social media engagement. Social media management tools, like Buffer and Hootsuite, can tell you:
- Engagement rates across platforms: This is the percentage of your audience actively interacting with your content through likes, comments, shares, and saves
- Direct and indirect brand mentions: Not just tagged posts, but conversations about your brand, products, or industry that don’t directly mention your handle
- Sentiment analysis and conversation quality: Whether mentions and comments about your brand are positive, negative, or neutral, plus the depth of meaningful customer interactions versus surface-level engagement
Some omnichannel CX platforms, like Nextiva, also provide social media management features. The benefit here is that all social media messages and reviews will be routed to your team inbox as tickets. No siloes.
People trust real experiences over marketing copy. Get customers who already love your brand to share their stories. This can help you build a positive brand reputation.And if you’re looking to build a list of brand advocates, start with the promoters from your NPS survey.


6. Email Engagement Metrics
Email is still a powerful way to connect with your customers, but it’s not enough to just hit “send.” Email engagement metrics show you how effective your email campaigns really are.
Most email marketing platforms automatically provide basic customer engagement metrics, such as open rates, click-through rates, and unsubscribe rates, in their dashboards.
Here are some other metrics you can track:
- Spam complaints: The number of recipients who mark your email as spam. This is a serious issue that can negatively impact the sender’s reputation and deliverability.
- Click maps: This shows which links, buttons, and content areas within your emails receive the most clicks. You can use this data to optimize your future campaigns.
- Forwarded and forwarded opens: Here, you track when recipients share your emails with others and whether those new recipients open the forwarded messages. This is a great way to understand your organic reach potential.
- Subscribers with the most opens: These are the people who consistently open your messages. They show high interest and can become brand advocates in the future.
Try A/B testing. Change one element at a time, like subject lines, send times, call-to-action buttons, or email length. This shows what works with your audience and can boost open rates, click-throughs, and conversions over time.
7. Customer Lifetime Value (CLTV)
CLTV tells you the total revenue you can expect from a single customer throughout their relationship with your business. It’s not just about a single purchase; it’s about the total value they bring throughout their entire lifecycle.
The higher your CLTV, the more valuable your customers are to your business. It also lets you test pricing models that may seem unprofitable at first but pay off over time.
For example, subscription businesses often use CLTV to justify free trials or discounted first months because the lifetime value makes the initial cost worthwhile.
How do you measure CLTV?
While calculating CLTV can be complex, a simplified formula is:
| Average purchase value x Average purchase frequency x Average customer lifespan = CLTV |
Let’s say your average customer spends $50 per purchase, makes 4 purchases per year, and remains a customer for 3 years:
$50 x 4 x 3 = $600 CLTV
CLTV benchmark: It’s good to aim for a CLTV at least 3-5 times your customer acquisition cost (CAC).
Build community around your brand through exclusive content, events, or user groups. Customers who feel emotionally connected to your brand stay longer and spend more. Apple, Starbucks, and a lot of local businesses thrive because they create that emotional connection.
8. Customer Churn Rate
Customer churn rate is the unfortunate reality of business, and it tells you how many customers leave you over a given period. Not only does a higher churn rate mean you’re losing customers (and revenue), it also signals to investors and partners that something’s fundamentally wrong with your business.
By tracking churn rates and understanding the patterns that resulted in that number, you can get an early warning about the market conditions or your product’s pitfalls. This, in turn, gives you the time to act before problems escalate and retain more customers.
How do you measure churn rate?
To calculate your churn rate, use the following formula:
| (Number of customers who churned in a set period / Total number of customers at the beginning of that period) x 100 = Churn rate |
If you started with 100 customers and lost 10 over a month:
10 churned customers / 100 total customers = 0.10 x 100 = 10% churn rate
Churn rate benchmark: While it varies by industry, a churn rate between 2% and 8% per year is considered healthy for most businesses.
When you spot customers showing signs of churn, reach out with targeted campaigns. Offer special deals, extra training, or premium support. Sometimes a small gesture is enough to re-engage a customer who felt neglected.
9. Customer Retention Rate
While churn rate focuses on the customers you’re losing, customer retention rate celebrates the ones you’re keeping. It’s a measure of how many customers stick with you over time, which is a great indicator of customer loyalty and how to improve customer retention.
Keeping existing customers happy is often more cost-effective than constantly chasing new ones. A high retention rate means you’re building a strong base of repeat customers who are less likely to leave. Moreover, the longer customers stay with you, the deeper the relationship becomes, making it harder for competitors to win them over.
Also, retention rates vary significantly by industry. A good retention rate falls between 70% and 80% annually. Aiming for a higher retention rate is always beneficial, as even small improvements impact your bottom line.
How do you measure customer retention rate
Here’s the formula to calculate CRR:
| [(Number of customers at the end of a period – Number of new customers acquired during that period) / Number of customers at the beginning of the period] x 100 = CRR |
If you started with 100 customers, gained 20 new customers, and ended the period with 110 customers:
[(110 – 20) / 100] x 100 = 90% retention rate
For enterprises or high-value customers, customer success programs help them see ongoing value and stay satisfied. For D2C businesses, on the other hand, loyalty programs that reward repeat purchases will give customers a reason to keep coming back.

10. Customer Health Score
Customer health score is a wellness checkup for your customer relationships. It’s a way to see how healthy your customers are based on how they use your product, how engaged they are with your brand, and whether they’ve had any support issues.
You can identify highly engaged customers or those who might be at risk of leaving, so you can step in and offer support before it’s too late. It also enables you to prioritize your efforts and focus on the customers who need the most attention.
Key components of a customer health score:
- Product or feature usage: How frequently and extensively the customer uses your product, feature, or service.
- Engagement: How actively the customer interacts with your brand, including website visits, email opens, and social media engagement.
- Support tickets: The number and nature of support requests the customer has submitted.
- Customer feedback: Customer sentiment expressed in surveys, reviews, and other feedback channels.
- Account activity: Changes in account activity, such as upgrades, downgrades, or changes in usage patterns.
Set up dashboards that calculate and update customer health scores in real time. That way, you can get alerted when customer engagement scores fall below your set threshold and stop small problems from becoming bigger ones.

11. Pages Per Session
Pages per session measures the average number of pages a user views during a single visit to your website or app. This gives you insight into how engaged customers are with your content and how effectively your site encourages exploration beyond the initial landing page.
Most website analytics tools will give you this data by default. However, the name might differ. Google Analytics 4, for example, calls this Views per Session.
The basic formula to measure pages per session is: Total Page Views / Total Sessions.
While the basic formula remains the same, most website analytics tools allow you to drill down further. For example, you can apply filters to analyze “Pages per session” for specific pages, traffic sources, and user segments.
Don’t save your CTAs for the end. Spread them throughout your content to point readers to complementary resources like tools or case studies so they stay interested.
12. Average Session Duration
Average session duration measures how long visitors spend on your website during a single session, from the moment they arrive until they leave or become inactive. The inactivity period is typically set at 30 minutes, though you can extend it to 45 minutes for text-heavy pages like blogs.
This metric is also tracked by default in your web analytics platform. You can usually find it in the Audience section.
Here are some points to keep in mind when looking at session durations. Longer sessions don’t always mean better engagement. Ten minutes on a blog post might show strong interest, but the same time on a contact page could mean the visitor is lost or frustrated.
Also, session duration is measured between the first and last recorded events. If someone leaves without clicking or scrolling, their time is logged as zero, even if they stayed on the page.
So look at session duration alongside other customer engagement metrics like pages per session, bounce rate, and conversions.
Add interactive elements or reveal content as users scroll. This keeps visitors engaged longer and gives you more accurate session duration data.
13. Bounce Rate
Bounce rate shows the percentage of visitors who leave your site after viewing just one page without taking any meaningful action like clicking links, filling out forms, or visiting other pages.
It tells you if your landing pages are engaging and encouraging visitors to explore. A high bounce rate often means visitors aren’t finding what they expected, or that your page content or UX has to be improved.
Bounce rate vs. exit rate:
- Bounce rate measures the percentage of visitors who leave your site after viewing only one page without taking any action
- Exit rate measures the percentage of visitors who leave your site from a page, regardless of how many pages they viewed before
The formula to calculate bounce rate is:
| (Unengaged sessions / Total sessions) × 100 = Bounce rate |
However, like with pages per session and average session duration, most web analytics platforms also give you bounce rates by default. According to Databox research from September 2024, the average bounce rate across all industries is 44.04%
Use exit-intent popups to show offers, content, or newsletter signup forms when visitors are about to leave. This is an unobtrusive way to give website visitors a reason to stay or come back.

14. Daily/Monthly Active Users
Daily Active Users (DAU) and Monthly Active Users (MAU) measure the number of unique users who engage with your product or service on a daily and monthly basis, respectively. These metrics are a vital indicator of product stickiness and growth, revealing how many people find your app valuable enough to use regularly. They are key customer engagement KPIs for businesses, as a high ratio of DAU to MAU shows that your users are highly engaged customers.
How do you measure DAU/MAU?
You measure DAU and MAU by counting the number of unique users who perform a specific action within your app or on your website within a 24-hour or 30-day period. This could be anything from logging in to a core feature.
Conduct user feedback sessions and analyze customer behavior data to identify the actions that lead to long-term engagement, then guide new users to complete those actions quickly and efficiently through personalized onboarding sequences or in-app tutorials.
Best Practices to Boost Customer Engagement Metrics
Now that you understand customer engagement tracking and KPIs, let’s see which customer engagement strategies can actually improve them. Here are some of the top best practices to help you track customer engagement KPIs:
- Set a North Star metric: Pick one main user engagement metric that matches your business goals and use it to guide decisions. This keeps your team focused and ensures everyone works toward the same objective.
- Gather qualitative data: Qualitative data helps you learn what customers prefer and why. Use interviews and open-ended surveys to understand why customers respond the way they do. This adds context to quantitative data and reveals emotions and motivations that metrics alone can’t show.
- Measure your strategy’s effectiveness: Establish baselines for your key customer engagement metrics and track progress over time. We suggest looking at your business average and industry benchmarks to find a balanced baseline so you can set realistic improvement targets.
- Spot opportunities for improvement: Regularly analyze your engagement data to identify patterns, drop-off points, and quick win, like how customers with CSAT scores between 7-8 respond more open to providing testimonials.
- Optimize the customer journey: Map out every touchpoint in your customer journey and identify friction points where engagement drops. Then, create a CX strategy to address friction metrics (like CES and bounce rates) and satisfaction metrics (like CSAT and NPS) to ensure holistic growth.
- Personalize the experience: Start with simple personalization, like using purchase history. Then, add predictive personalization that anticipates customer needs based on engagement patterns. Be sure to follow customer experience best practices by maintaining transparency about data usage and providing personalization controls.
- Get the right tools: Companies use an average of 6.3 tools, according to the 2025 Nextiva CX Trends Report. We recommend consolidating where you can to reduce complexity and make it easier for your team to track and act on customer engagement metrics. In fact, 81% of the companies surveyed for the report say they plan to do this.

Track Customer Engagement Metrics Like a Pro With Nextiva
Nextiva is a unified CX solution that brings all customer conversations across all channels into one platform. This gives you a single view of customer engagement metrics, making it easier to track scores and spot trends across the entire customer journey.
With everything in one place, your team can quickly identify at-risk customers, measure the impact of campaigns, and deliver personalized experiences that improve satisfaction and loyalty.
We can’t shape your company’s training or culture, but we can give you the tools to support them. If your customer experience and user engagement metrics aren’t where you’d like them to be, now’s a good time to explore what Nextiva can do.
Talk to a Nextiva expert about how our tools can help.
Net Promoter, Net Promoter Score, and NPS are trademarks of NICE Satmetrix, Inc., Bain & Company, Inc., and Fred Reichheld.
The complete call center solution.
Need to lift your CX metrics? See why sales and support teams use Nextiva to deliver a better customer experience.