 Customer Experience
  Blog
Blog  Business Communication
  Leadership
  Marketing & Sales
  Productivity
  VoIP
VoIP 


Monitoring key performance indicators (KPIs) is essential for every call center manager. Call center benchmarking enables them to optimize workforce planning, identify employee improvement potential, and streamline processes. Regular data analysis against established standards not only increases productivity but also improves the customer experience.
To achieve outstanding call center performance, you must measure your metrics against evolving industry standards. With 80% of contact centers expected to use AI technologies for routing or coaching, benchmarks have shifted from pure speed to quality and problem-solving.
This article covers everything you need to know about call center benchmarking: the methodology, key industry benchmarks, and the analysis of current performance data across sectors.
What Is Call Center Benchmarking?
Call center benchmarking is the process of comparing your contact center’s key performance indicators and operational processes against industry standards, direct competitors, or your own historical data. It provides a concrete measure of success and helps managers look beyond simple internal goals (such as “answer calls faster”) and establish objective, market-driven standards (such as “achieving one of the top 10% of the industry in response time”).
Call center benchmarking reveals precisely where your operations are lagging and where they’re leading the way.
How To Benchmark Your Call Center
Learning how to set benchmarks for your team is a critical part of call center performance management. So is learning how to use those benchmarks to compare your service quality to your competitors’ and deploy the data to improve your service. Let’s review the steps you should take to benchmark your call center.
Identify relevant call center KPIs
You can track plenty of call center metrics, but prioritizing KPIs that help you assess customer satisfaction and operational efficiency is particularly important.
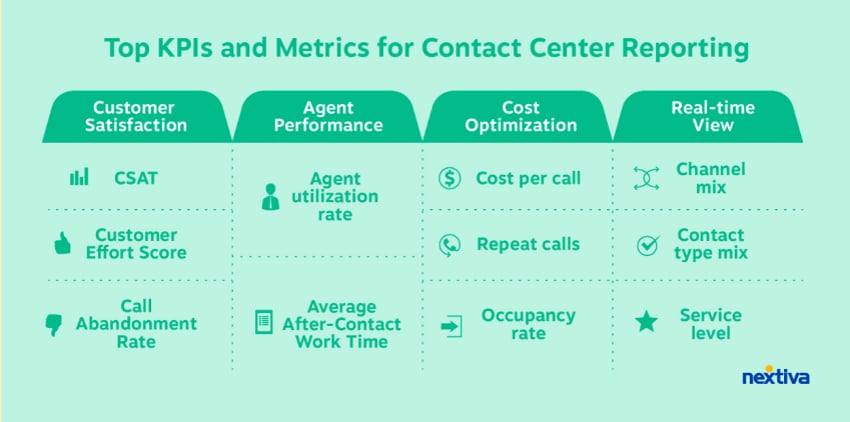
Some call center metrics with recently shifted benchmarks that you should track include:
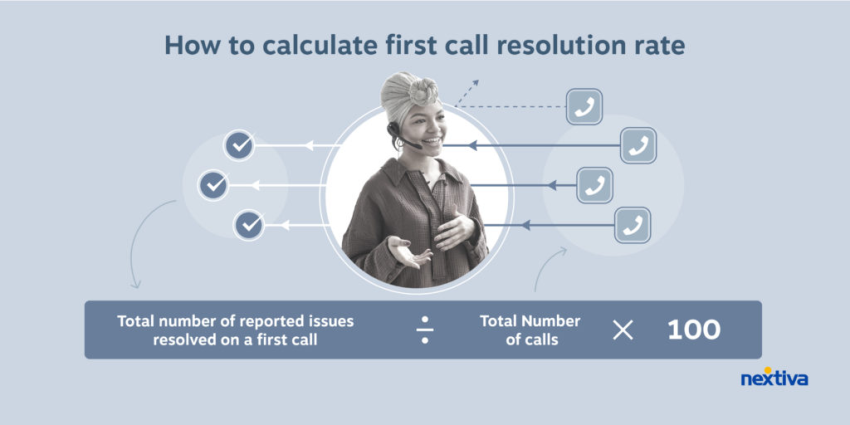
- First call resolution (FCR) rate: This metric, which is sometimes referred to as “first contact resolution rate,” tells you what percentage of the time you can resolve a customer’s issue in a single interaction.
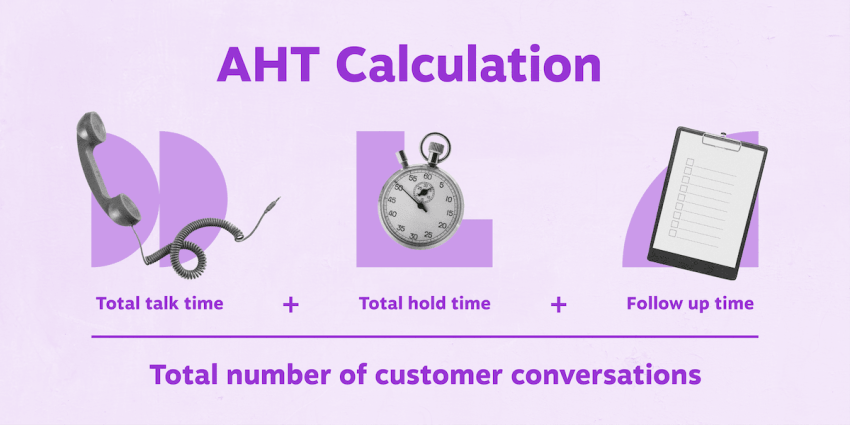
- Average handle time (AHT): This metric (which includes talk time, hold times, and transfer times) tells you how much time it takes on average to resolve a customer concern.
- Customer satisfaction (CSAT) scores: This metric, which uses direct feedback from customer surveys, tells you how happy customers were with their recent interactions.
While the above metrics are the most important ones for most call centers, the following metrics may also be helpful:
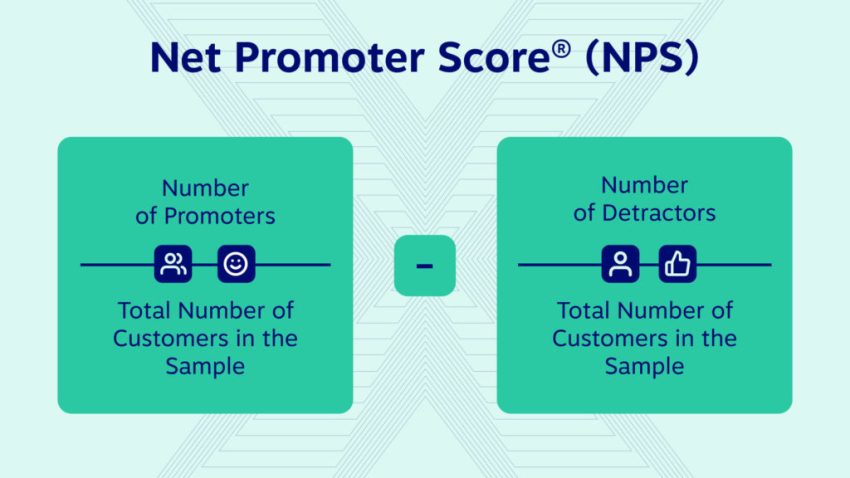
- Net Promoter Score (NPS): How likely your client is to recommend your business to someone else — the percentage of detractors is subtracted from the percentage of supporters
- Average speed of answer: How long it takes on average to answer a customer’s call
- Call abandonment rate: What percentage of calls your customers end before being connected to agents — often because of long wait times.
- Customer effort score (CES): How much effort customers put into resolving issues or interacting with your company — long response times and low FCR rates often raise this score
Need a quick refresher course on different metrics? Check out our list of call center abbreviations.
Collect and analyze data
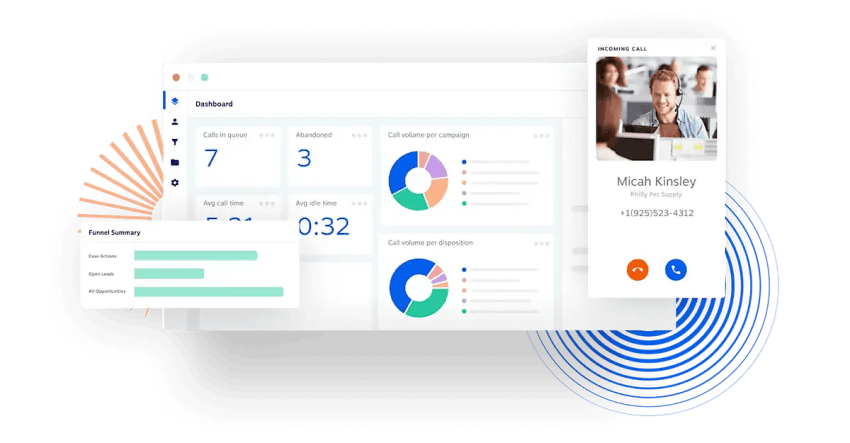
Call center software is the most effective tool for assessing KPIs over specific time periods. This software tracks trends to analyze current performance and assesses the impact of training and optimization initiatives.
In addition to the metrics discussed above, your call center dashboard should provide insights into agent productivity, team performance, overall customer happiness, and estimated call volumes.
Compare your performance data with industry standards
Research industry benchmarks to evaluate how your call center’s performance data compares with your direct competitors’ and with overall industry standards. This can be crucial to understanding whether you’re meeting current customer expectations and should include an assessment of important call center performance metrics.
Comparing your performance data with industry standards is the best way to figure out what things your call center excels at and what opportunities you have for improvement.
Set realistic goals
Based on your analysis, establish achievable targets for each KPI to drive performance improvements.
“Achievable” is the key concept here. If your AHT is 15 minutes and benchmarks are closer to five minutes, you may want to provide training and ask agents to start by shooting for 10-minute handling times while maintaining strong FCR rates and CSAT scores.
Implement continual monitoring
Track your KPIs as you implement strategic changes to improve benchmark performance. This can help you ensure you’re making progress toward your goals, assess the efficacy of your strategies, and adjust them as necessary.
Make sure that you’re monitoring performance across the entire customer experience to improve it for callers at all stages of the buying experience.

New Standards of Excellence for Call Centers
Technological advancements and business competition have resulted in evolving customer expectations that have raised the bar for call center performance.
Simply resolving a customer concern over time isn’t enough. Modern standards emphasize the following:
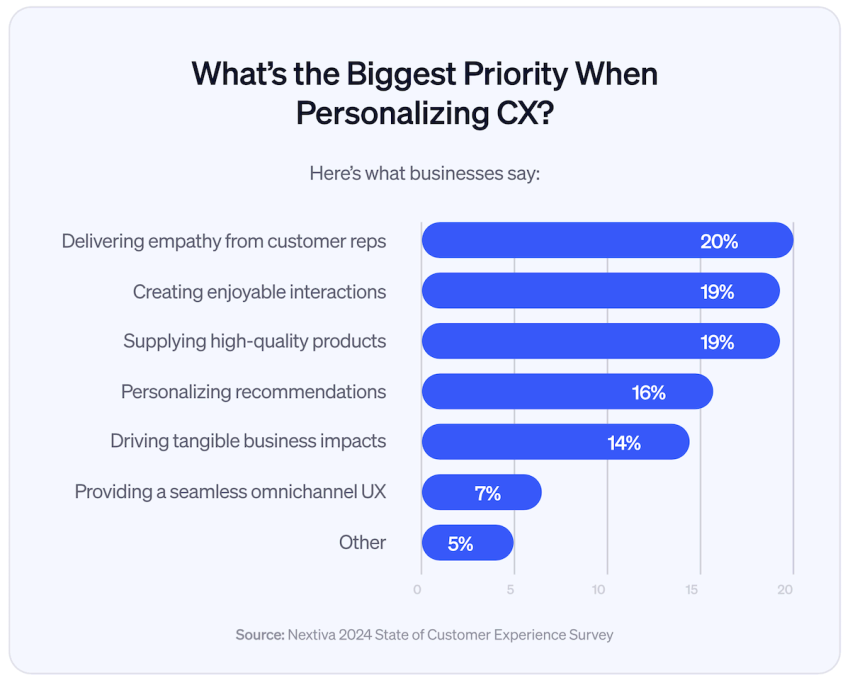
- Personalized customer experiences based on callers’ interactions and purchase histories, which ideally offer customized solutions that meet their needs
- Efficient issue resolution, which minimizes ongoing customer effort
- Proactive engagement from brands, which ensures the customers are happy with their experiences
Integrating AI, deep automation, and improved agent training can enhance service levels and operational efficiency. For example, using advanced interactive voice response (IVR) systems to offer skill-based routing can ensure that callers are immediately sent to the departments that can best meet their needs. This reduces the call center’s AHT and CES, making for faster (and better) customer interactions.
Old vs. New Benchmark Standards for Call Centers
As benchmark standards evolve, it’s important to keep track of the changes. Let’s compare the old benchmark standards for phone-call handling with the benchmarks that call centers currently use.
FCR rate
Your FCR rate is critical to reducing the total number of calls it takes for customers to resolve their issues. This improves customer satisfaction rates and reduces repeat calls that can increase agents’ workloads.
Previously, achieving an FCR rate of 70% was considered satisfactory. Now, however, you want to strive for an FCR rate of 80% or higher. This new standard can significantly increase CSAT scores and reduce operational costs.
AHT
Your AHT plays a role in operational efficiency, but its impact on performance metrics has shifted.
Previously, six minutes was the benchmark for AHT. This included talk time and hold time. Now, the focus has shifted to resolving issues efficiently — even if doing so takes longer — to improve customer satisfaction. Many call centers are prioritizing other customer service metrics and finding ways to potentially reduce AHT based on customer preferences.
CSAT
CSAT scores are based entirely on customer feedback and provide incredibly valuable qualitative data regarding the customer experience that pure call volume data alone can’t provide. CSAT is one of the most important customer engagement metrics to track.
Previously, CSAT benchmarks hovered around 75%. Now, new benchmarks suggest that most businesses should aim for a CSAT score of 85% or higher, which reflects a commitment to exceptional customer experiences.
💪 The CX Leader’s Guide to Contact Center Customer Experience
Industry Examples of Benchmarking
While general contact center benchmarks are helpful, leveraging industry-specific call center benchmark data can be essential. Some industries may have more complex customer needs, which automatically increase their AHT or lower their FCR rates. Here is some essential industry-specific benchmark data to get you started.
Health care
Health care call centers often deal with complex customer needs, from booking appointments to answering patients’ urgent medical questions. These are the benchmarks to shoot for:
- FCR: The average FCR rate in healthcare call centers is approximately 71%, indicating there is room for improvement in resolving patient inquiries on the first contact.
- AHT: The AHT in health care call centers is 6-8 minutes, reflecting the complexity of healthcare-related calls. However, lowering your AHT is no longer as big of a priority as raising your FCR rate.
- CSAT: Top-performing healthcare centers aim for 85%+, as satisfaction is closely tied to trust and clarity of information.

Banking
Financial call centers may manage sensitive customer questions and assist with important tasks like making payments or closing accounts. This is the performance data to keep in mind:
- FCR: Financial institutions target an FCR of 70–75%, balancing efficiency with stringent security protocols.
- AHT: The typical AHT is roughly 4–6 minutes, depending on whether the call is a simple balance check or a complex fraud claim.
- CSAT: Banks aim for benchmarks of 80%+, as customers expect high accuracy and speed when dealing with their money.
Retail
The retail industry may have more straightforward customer inquiries, with concerns often centered around subscription management, product returns, and product care. These are the benchmarks to consider:
- FCR: Retail centers often achieve higher rates, averaging 75–80% due to the transactional nature of inquiries.
- AHT: Retail generally maintains a shorter AHT of 3–5 minutes.
- CSAT: This sector is highly competitive, with leaders aiming for 85–90% CSAT to differentiate themselves through superior service.
Insurance
Insurance agencies often handle complex customer issues regardless of the types of policies they offer. There are stringent data security and privacy requirements in the insurance industry. Its benchmarks include the following:
- FCR: The industry average is around 70–75%, as many claims require follow-up work.
- AHT: Insurance calls average 7–10 minutes or longer. Detailed discussions about coverage cannot be rushed without risking compliance issues.
- CSAT: Benchmarks sit at 80%+, with satisfaction heavily linked to the clarity of communication and ease of the claims process.
Tips for Improving Your Benchmarked Performance
If your current call center performance doesn’t quite meet industry standards, focus on your performance data to identify which factors negatively impact the customer experience. That said, the following strategies may help:
- Optimize staffing to minimize hold times: This ensures that specialty agents are always on staff and reduces the risk of agent burnout.
- Offer self-service options through IVR systems or online: This can reduce the number of incoming calls and lighten call center agents’ workloads.
- Add omnichannel support to scale staffing impact: This helps scale inbound call center operations’ coverage beyond telephony.
- Use follow-up surveys after calls to determine why customers contacted you: This can help you focus on delivering positive customer experiences.
- Use real-time data to deliver better support and create more satisfied customers: This can help your team do a better job of addressing customers’ issues.
- Provide ongoing agent training to properly address customer needs based on industry benchmarks: This enables agents to develop the empathy they need for dealing with sensitive client issues in industries including insurance and health care.
- Leverage real-time coaching: Use AI tools that listen to calls and prompt agents with the best answers live, improving both AHT and FCR.

Better Benchmark Tracking With Nextiva
Call center managers can benefit from comparing their performance data to industry benchmarks, ensuring they’re meeting — and exceeding — customer expectations. With new standards of excellence now becoming the norm, staying on top of performance tracking is important.
Nextiva’s contact center solutions include dedicated offerings for multiple industries and general call center software. Our advanced analytics system makes it easy to track benchmark data, allowing call center managers to identify trends and potential opportunities for growth and decide how best to allocate resources.
Nextiva also offers advanced functionality to improve customer support quality, which can improve customer loyalty and retention.
Ready to see how you’re measuring up to the competition? Get started with Nextiva today. 👇
Top AI-Powered Contact Center Solution
Transform your customer interactions with a contact center platform that saves you time and money, reduces agent stress, and adapts to fit your needs.
Call Center Benchmarking FAQs
A KPI (key performance indicator) is a metric you track to measure your own performance (e.g., “Our current average hold time is 4 minutes”). A benchmark is the standard you compare that metric against (e.g., “The industry average hold time is 2 minutes”). Benchmarks give your KPIs context.
With the rapid adoption of AI tools, it’s recommended to review benchmarks quarterly. Annual reviews are no longer sufficient because customer expectations and technology (like automated coaching and routing) are evolving too fast.
The 80/20 rule (or Service Level) is a classic benchmark stating that 80% of calls should be answered within 20 seconds. While still relevant, many modern centers prioritize first call resolution (FCR) over speed, realizing that customers prefer waiting an extra minute to get their issue solved the first time.
AI typically increases the standard for human agents. Because AI chatbots now handle simple queries (like password resets), the calls that reach human agents are more complex. This can lead to longer AHT but should also lead to higher satisfaction scores if managed correctly.
Generally, a call abandonment rate between 2% and 5% is considered acceptable. If your rate rises above 5%, it indicates that wait times are too long or your IVR menu is too frustrating for callers.
Sources: