
 Customer Experience
  Blog
Blog  Business Communication
  Leadership
  Marketing & Sales
  Productivity
  VoIP
VoIP 


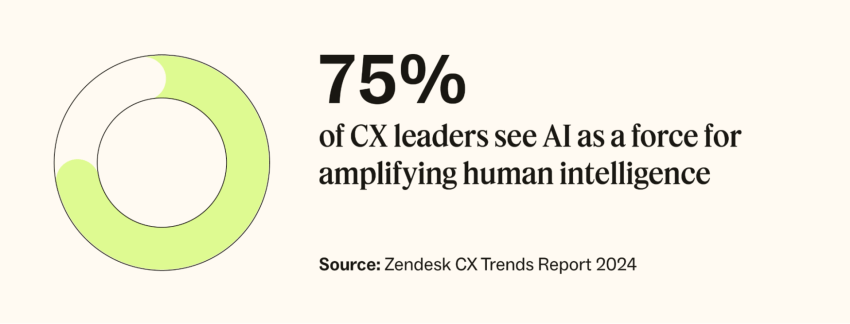
According to our State of CX report, 77% of buyers expect immediate engagement, and 81% want proactive communication from brands. If you’re not meeting those expectations, they’re likely to move on. That’s why customer experience analytics matter more than ever. They help you understand customers’ feelings at every touchpoint and respond quickly to their concerns.
This article will cover what customer experience (CX) analytics are, why they’re critical to keeping customers happy, and which metrics actually move the needle. We will also discuss how to get started, the best tools for the job, common challenges, and how to boost your ROI by fixing common weak spots.
Where Do You Rank on the AI Maturity Curve?
Take the 5-minute assessment and get a personalized score and recommended next steps.
What Is Customer Experience (CX) Analytics?
Customer experience (CX) analytics is the process of collecting, analyzing, and interpreting data from customer interactions, feedback, and behavior across all your digital and physical channels. It provides a deeper insight into user behavior, customer engagement, emotions, and sentiment, helping you understand what’s working and what isn’t, at every stage of the customer journey.
These insights play a key role in customer experience management (CEM). By tracking key customer experience metrics, you can identify trends, spot friction points, and improve how you respond to customer needs. In short, CX analytics enable smarter decision-making and better experiences by transforming raw data sources into actionable insights.
Why Is Customer Experience Analytics Important?
Customer experience analytics give you valuable insights into customer habits, preferences, and pain points by analyzing metrics like purchasing history and demographic information. This helps you tailor your products, services, and marketing campaigns to drive growth and profitability.
Here are the key business benefits that intelligent CX measurements offer:
Understand customer behavior
Every time customers interact with your business, they leave behind valuable clues. Digital customer experience analytics help you understand what customers want, what frustrates them, and what keeps them coming back. With the right CX data analytics platform, you can track behavior across various customer touchpoints and adjust your strategy to meet real-time needs.
Personalize experiences
49% of buyers make impulse purchases after a personalized experience. Personalization can help increase customer retention by catering to your customers’ needs by segmenting customers, tracking behaviors, and adjusting content dynamically.
Improve agent effectiveness
CX analytics give agents instant access to key customer info, helping them respond faster and more personally. With real-time data and guided workflows, agents can make smarter decisions and resolve issues more efficiently.
Customer analytics tools also support automation, reducing repetitive tasks and letting agents focus on complex problems, leading to a more productive, effective support team.
Drive decision-making & revenue
With the help of customer experience analytics software, your team can make smarter, faster decisions backed by real numbers. From user feedback to support data, everything feeds into one system for easy visualization and data analysis. That means better planning, fewer surprises, and stronger performance across your contact center team and beyond.
Customer satisfaction analytics can also unlock hidden opportunities for revenue growth. By analyzing behavior, preferences, and past purchases, you can fine-tune cross-sell and upsell strategies that build loyal customers.
For example, contact centers can use CX insights to recommend relevant products or services during support calls, increasing value for both the customer and the business.
Retain more customers
CX analytics reveal what drives customer loyalty and CSAT, from product quality to personalization. Tracking these factors can help reduce churn, improve customer lifetime value (CLV), and retain more customers.
As feedback and behavior data roll in, patterns start to emerge, helping you spot pain points along your customer journey map. Predictive analytics and machine learning can spot issues before they happen, like forecasting high call volumes so you can staff support teams accordingly.
Types and Sources of Customer Experience Data
To make the most of analytics, it’s important to understand where your data comes from. Each touchpoint generates insights that help build stronger customer relationships. Here are the three main types.
Direct data (what customers tell you)
Direct data comes straight from your customers. It’s based on what they say, how they rate your service, and the feedback they choose to share. This is usually collected through Voice of the Customer (VoC) programs.
Here are some examples:
- Customer satisfaction score (CSAT) surveys: Measure how satisfied customers are after a specific interaction or experience.
- Net Promoter Score® (NPS): Gauges how many customers are likely to recommend your brand to others.
- Voice of the customer (VoC): Gathers opinions, customer expectations, and preferences directly from customer feedback.
- Post-interaction surveys: Provide focused insights right after a service call, chat, or transaction
- Customer effort score (CES): Captures how easy or hard it was for a customer to complete a task or resolve an issue.

Indirect data (what customers do)
Indirect data is what you collect by observing customer behavior and actions, rather than their direct words. This includes activity across web and mobile applications, service data, and usage patterns, a key part of product analytics.
Examples include:
- Average handle time (AHT): Measures the time spent by support teams on each customer call, used to assess efficiency.
- Click-through rates (CTR): Track how often users click on a specific link or offer.
- Customer lifetime value (CLV): Predicts the total revenue a customer may bring over the course of the relationship.
- Customer churn rate: Tracks how often customers leave your brand, helps with retention strategy, and boosts retention rate.
- Average spend: Shows purchasing behavior across channels and customer types.
- Voice and chat metadata: Analyzes the structure and frequency of support interactions for optimization.
- Social listening: Monitors what people say about your brand across platforms — helpful in spotting sentiment shifts.
- Online review monitoring: Tracks reviews and ratings to identify recurring issues or highlight strengths.
Inferred data (what the data suggests)
Inferred data relies on interpretation and prediction. It combines patterns in transactional data and behaviors to anticipate what customers might do next.
- Sentiment analysis: Uses AI to interpret tone and emotion in customer messages or reviews.
- Predictive behavior: Forecasts future actions, like churn risk or upsell potential, based on past activity.
- Behavioral segmentation: Groups customers by habits or preferences to tailor marketing and support.

The Role of VoC vs. Behavioral Analytics
Voice of Customer (VoC) is direct feedback (what customers say), and behavioral analytics are indirect data (what customers do).
- VoC (direct): Tells you the why behind a customer’s feelings. They are explicitly telling you, “I am dissatisfied because the wait time was too long.”
- Behavioral (Indirect): Shows you what happened. You observe that the customer waited for 10 minutes, visited the help page three times, and then abandoned their cart.
A strong customer experience strategy combines both. The behavioral data flags a problem (cart abandonment after a long wait), and the VoC data (a survey) confirms why it happened, giving you a clear path to a solution.
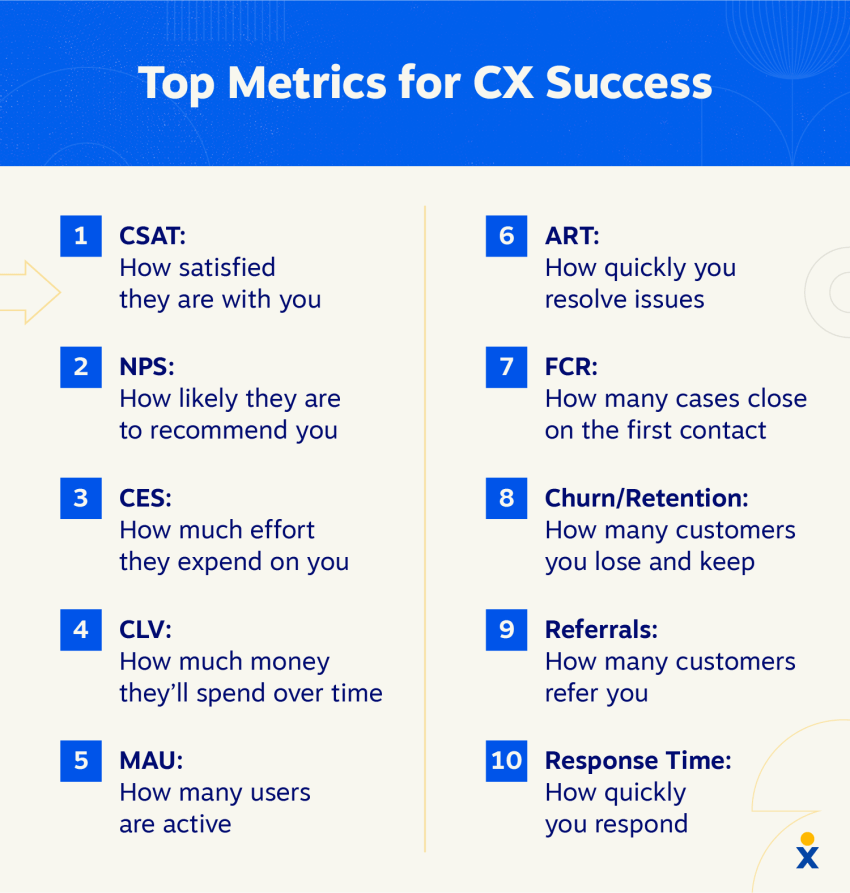
Key Customer Experience Metrics and How to Measure Them
Measuring customer experience without the right KPIs is like baking a cake with salt instead of sugar — wrong ingredients, wrong results. The right analytics rely on clear, trackable metrics.
Here are some of the most important ones, plus how to calculate them:
| Metric | Formula | What it measures |
|---|---|---|
| Net Promoter Score (NPS) | % Promoters – % Detractors | How likely customers are to recommend your brand |
| Customer satisfaction (CSAT) | (Total Positive Responses ÷ Total Responses) × 100 | Customer satisfaction after a specific interaction |
| Customer effort score (CES) | Average score from “How easy was it to resolve your issue?” | How much effort a customer has to put in |
| Customer lifetime value (CLV) | Average Purchase Value × Purchase Frequency × Customer Lifespan | The estimated total revenue a customer brings over time |
| Churn rate | (Lost Customers ÷ Total Customers at Start) × 100 | How many customers stop doing business with you |
| Retention rate | ((Customers at End – New Customers) ÷ Customers at Start) × 100 | How well you retain existing customers |
| First contact resolution (FCR) | (Issues Resolved on First Contact ÷ Total Issues) × 100 | How often issues get resolved on the first attempt |
| Average handle time (AHT) | (Talk Time + Hold Time + Follow-Up Time) ÷ Total Calls | The efficiency of your contact center team |
How To Get Started With Customer Experience Analytics
Getting started with customer experience analytics means following a clear, step-by-step approach: collecting the right data, analyzing it effectively, and using the insights gained to improve the customer journey.
- Set benchmarks for your goals: To increase customer satisfaction, start by setting clear, measurable goals. Define what success looks like (e.g., reducing customer churn by 5%, increasing NPS by 10 points) and choose key performance indicators (KPIs) that align with these results.
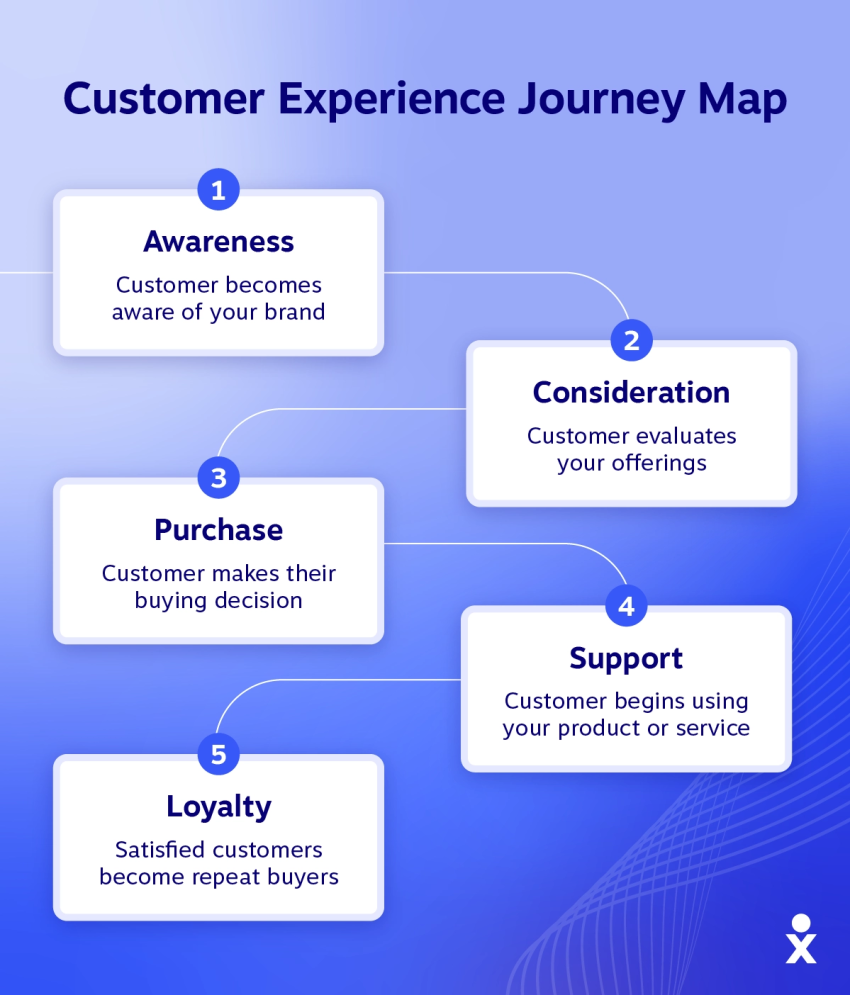
- Map the customer journey: Mapping the customer journey helps you understand where, when, and how customers interact with your brand, allowing you to focus on the most important moments. Identify impactful touchpoints such as onboarding, support calls, and checkout processes.
- Capture omnichannel data: An omnichannel customer experience is created through fully integrated customer channels. Your customers already use three to five different channels. You need to collect data from all channels (phone, chat, email, social media) to gain a unified view of your customer experience.
- Select and calculate key KPIs: From the table above, select the KPIs that best align with the goals you defined in step 1.
- Analyze the data: Once you’ve collected data, it’s time to get down to business. Segment users by behavior, demographics, or their position in the customer journey to identify patterns. Use cohort and predictive analytics to identify trends over time and anticipate future needs.
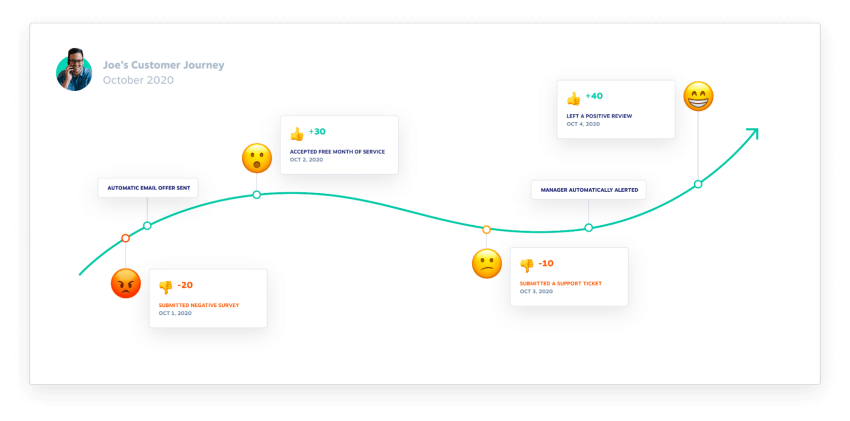
- Take action and close the feedback loop: Use insights from customer feedback to fix problems, personalize communication, and improve your product. Close the feedback loop by staying in touch with customers after implementing changes. This builds trust because it shows you’re listening.
Top Customer Experience Analytics Tools To Try
The right customer experience analytics tools help you turn raw data into clear action. To get the most value, look for platforms that offer omnichannel data collection, automation, and smooth integrations. Below are some of the best options available in 2026.
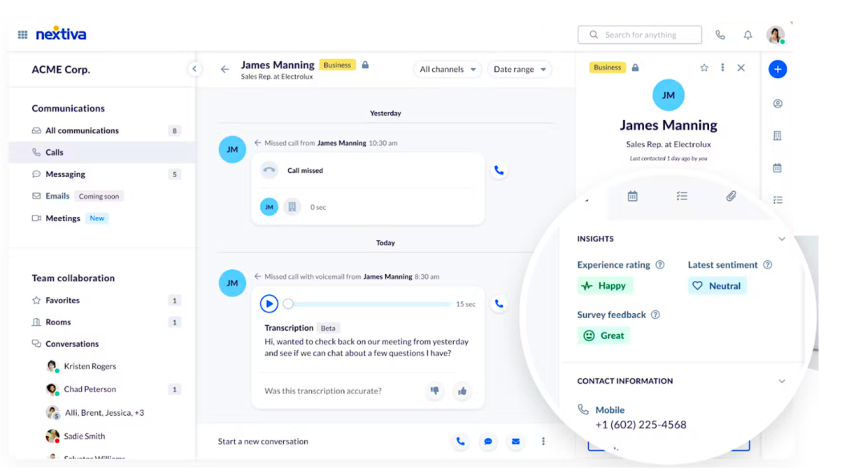
1. Nextiva
Best for: Unified journey analytics
Nextiva brings all customer interactions, including voice, video, email, and chat, into one dashboard. The unified customer experience management platform gives teams a complete omnichannel view of every customer journey. Its automation tools help route inquiries, trigger follow-ups, and speed up resolutions. While smaller teams may find it more advanced, it’s a scalable choice for growing businesses that want deep visibility into customer behavior.
Key features
- Unified, omnichannel interaction analytics across all communication channels
- Real-time dashboards for service performance and engagement trends
- Automated alerts for unusual activity or customer sentiment shifts
- Integration with CRM and helpdesk systems
Pricing
Nextiva’s customer experience plans start with tier-based pricing based on the number of users and included features. Businesses can request a custom quote depending on their communication volume and analytics needs.
Business plans for small businesses start at $15 to $75 per user per month (for example, Core, Engage, and Power Suite CX), while enterprise plans begin at $75 per user per month and above (for example, Essential, Professional, and Premium).
2. Hotjar
Best for: Visual website behavior analytics
Hotjar helps you understand how visitors use your website. Its heat maps show where people click, scroll, and move their cursor. Session recordings replay complete browsing sessions so you can spot usability issues and friction points. While Hotjar focuses on website behavior and provides valuable UX insights, it doesn’t capture customer interactions beyond your website or include contact center or omnichannel data.

Key features
- Heat maps and session recordings for website behavior
- On-page surveys and feedback widgets
- Conversion funnel tracking
- Integration with Google Analytics and CRM tools
Pricing
Hotjar offers a free basic plan with limited recordings and heat maps. Paid plans start with tiered pricing based on the number of sessions and data retention period.
Hotjar plans start with a Free option at $0 forever. The Growth plan, the most popular, costs $40 per month. The Pro and Enterprise plans require booking a demo.
3. Qualtrics
Best for: Advanced VoC and survey collection
Qualtrics helps organizations collect and analyze structured and unstructured customer feedback at scale. It supports many survey types, distribution methods, custom logic, and integrations with CRM systems. The platform offers detailed reporting and text analytics, though setup can take time for smaller teams.

Key features
- Advanced reporting and survey creation, and branching logic
- Sentiment analysis and predictive insights
- Real-time dashboards and reporting tools
- Workflow automation for feedback responses
Pricing
Qualtrics pricing is quote-based and depends on the specific suite (for example, Customer Experience, Employee Experience, or Strategic Research) and the modules included. A Free Survey account is available for basic features.
4. Gainsight
Best for: B2B customer success and retention
Gainsight focuses on customer success management for B2B and SaaS companies. It combines usage data, support activity, account metrics, and feedback to calculate a customer health score. This helps teams spot churn risks early and take proactive action to retain clients.

Key features
- Customer health scoring based on real-time data
- Predictive churn analysis
- Account management dashboards and workflow automation
- Integration with Salesforce, HubSpot, and major CRMs
Pricing
Gainsight pricing varies based on your specific needs and how your business wants to scale. The platform offers custom plans, designed for mid-market and enterprise businesses. You need to request a quote to get exact pricing.
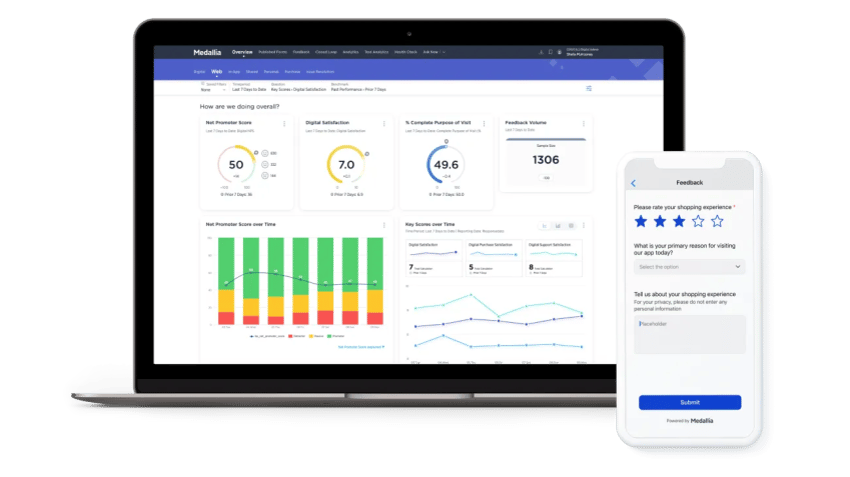
5. Medallia
Best for: Real-time feedback and text analytics
Medallia captures feedback across channels like web, mobile app, SMS, and in-store touchpoints. It processes responses in real time, giving teams immediate visibility into customer sentiment. The platform helps brands understand pain points and improve experiences quickly.
Key features
- Real-time feedback collection from multiple channels
- Built-in text and sentiment analytics for unstructured feedback
- Role-based dashboards and automated reporting
- Predictive insights and automated alerts
- Integration with CRM and ticketing platforms
Pricing
Medallia pricing is quote-based and tailored for large enterprises. Costs depend on units, users, business size, industry, and required features. You must contact Medallia’s sales team for a custom quote based on its EDR model.

Common Challenges With CX Analytics & How to Overcome Them
Implementing a customer experience analytics strategy can be powerful, but businesses often struggle with messy data, unclear insights, or feedback that goes nowhere. Here are a few challenges that can crop up and how to tackle them:
Data silos and integration pain
If your data lives in too many places, your insights won’t add up. Many businesses collect customer data across different systems but fail to connect the dots. Without integration, you miss the full picture of the customer journey.
Use a unified communications platform (like Nextiva) or tools with powerful, open APIs that can integrate your various systems into a unified customer experience dashboard.
Lack of clear actionable insights
Gathering customer feedback is one thing, but turning it into decisions is another. Without tools that highlight patterns and trends, teams end up guessing instead of improving. Smart platforms can turn raw data into real action.
Start with a specific goal and a few key metrics. Use platforms with AI-powered analytics that can automatically surface trends and anomalies for you.
Slow or ineffective feedback loops
Delayed responses can damage trust and let small issues snowball. If your team isn’t acting on feedback fast enough, customers can feel ignored, and churn follows.
Use customer experience automation to create real-time alerts for poor feedback (e.g., a 1-star CSAT score). This can instantly create a task for a manager to follow up with that customer, closing the loop in hours, not weeks.
Maximizing the Value of Customer Experience Analytics
Customer journey analytics is key to greater customer satisfaction, loyalty, and a better customer experience. The value of customer experience analytics unfolds when you have a complete view of customer behavior to anticipate needs, address problems, and personalize the customer experience more effectively.
To maximize the benefits, focus on integrating your data. Don’t analyze website behavior in isolation. Combine it with data from your contact center, survey results, and CRM history.
For example, if you discover that a customer with a low NPS score also made three long support calls and didn’t use the most important feature of your product, you’ll gain valuable insights for continuous improvement.
CX Analytics Use Cases
Customer experience analytics do more than generate reports. They uncover patterns, guide decisions, and help teams respond to real customer behavior. Below are practical ways businesses use CX analytics to drive measurable results.
1. Identifying and reducing churn
Analytics help businesses detect early signs of churn. By studying patterns such as a drop in product usage, repeated support issues, or declining satisfaction scores, teams can identify customers at risk of leaving. With this data, companies create predictive health scores that signal when to reach out with targeted support or personalized offers. Acting early reduces churn and improves long-term retention.
2. Optimizing the digital experience
Digital experience analytics show how customers interact with websites and apps. For instance, with tools like Hotjar, a marketing team can find that 80% of users abandon a checkout form at the same step. That insight points directly to a design or usability problem. Fixing it immediately improves conversions and reduces frustration.
3. Improving agent and contact center performance
CX analytics give managers a clear view of agent productivity and service quality. For instance, an agent with a higher average handle time but a stronger first contact resolution rate may be thorough and effective, not slow. Another agent with low AHT but poor FCR might be rushing customers. Data like this helps managers coach better, balance workloads, and raise service standards across the team.
4. Personalizing marketing and sales
Analytics links customer behavior with marketing and sales performance. Connecting engagement data to a CRM helps teams segment customers based on loyalty, feedback, and purchase history.
For example, customers who gave a high NPS score but haven’t purchased recently can be grouped for a targeted (“we miss you”) re-engagement campaign. Data-driven personalization helps ensure that every message is relevant and timely, rather than generic or repetitive.

5. Measuring the impact of product changes
After a new feature launch or process update, analytics help measure customer response. Tracking customer experience metrics like adoption rates, task completion times, and satisfaction scores shows whether the change improved the experience or created new friction. These insights guide future product updates and keep teams focused on changes that deliver real value.
6. Enhancing self-service channels
CX analytics show which help articles, chatbots, or FAQs customers use most and where they still need live support. Businesses use this data to refine content, simplify instructions, and improve chatbot accuracy. The result is a more accurate, smoother self-service experience that reduces ticket volume and increases customer satisfaction.
Data Privacy, Compliance, and Ethics in CX Analytics
The more customer data you collect, the more important it becomes to handle it responsibly. Customers are now aware of their data privacy rights, and improper data handling is the fastest way to lose trust. Follow these best practices to avoid the unethical use of analytics tools:
- Compliance: Comply with data protection regulations such as the GDPR (in Europe) and the CCPA (in California). This includes obtaining explicit consent for data collection, providing users with access and deletion rights, and protecting data against data breaches.
- Data ethics: Besides legal requirements, ethical data practices are about transparency. Make it clear to your customers what data you collect and why (e.g., “We use behavioral data to improve your website experience”). Never sell customer data without their explicit consent.
- Building trust: The ethical use of analytics tools builds trust with your customers. When customers believe you’re genuinely using their data to improve their user experience (and not just for intrusive marketing), they’re more likely to remain loyal.
Grasp the Entire Customer Journey Easily With More Complete Data
Understanding the complete customer journey is key to improving experience, retention, and satisfaction. Customer experience analytics give you access to complete data from every interaction, offering a clearer view of customer behavior to anticipate needs, address pain points, and personalize the customer experience more effectively.
With Nextiva, you can easily unify customer data, track behavior across channels, and gain actionable insights through advanced analytics. Whether aiming to improve customer experience, enhance product offerings, or drive sales, Nextiva puts the power of comprehensive customer insights in your hands.
A complete customer experience center solution.
See why top brands use Nextiva to handle calls at scale. Easy to use. Fast setup.
Customer Experience Analytics FAQs
Customer experience analytics can benefit any business that wants to measure and improve customer satisfaction, retention, and other loyalty metrics. In short, any business with paying customers can benefit from measuring CX analytics.
CX performance is measured using key metrics such as CSAT scores, Net Promoter Score (NPS), and customer effort score (CES). These metrics track customer sentiment and the ease of their interactions with your business, giving you insights into the effectiveness of your CX efforts.
AI helps analyze large volumes of customer data (especially unstructured data like text comments), identify patterns, and predict behavior. It enables you to personalize experiences, spot trends, and automate processes like feedback collection.
The best platform depends on your needs. Nextiva stands out for its ability to unify data across all touchpoints, provide AI-driven insights, and offer easy integrations, making it ideal for a comprehensive, scalable solution.
The ROI depends on your industry and goals. To maximize ROI, treat customer experience as a core part of operations across all teams. As businesses invest more in CX, the global CX management market is projected to grow at a 15% CAGR, reaching over $30 billion by 2030.
Net Promoter, Net Promoter Score, and NPS are trademarks of NICE Satmetrix, Inc., Bain & Company, Inc., and Fred Reichheld.