
 Customer Experience
  Blog
Blog  Business Communication
  Leadership
  Marketing & Sales
  Nextiva News
  Productivity
  VoIP
VoIP 

Customers expect prompt support when they contact customer care.
Reaching out to a company is extra work for them because they rarely plan it. They face an issue and try to get hold of the customer service team to get it resolved as soon as possible. If they don’t get a response quickly, or a late response stalls their process, it becomes a poor experience.
In customer service, giving prompt assistance to everyone becomes tricky with multiple priorities. A customer service rep shouldn’t have to be a juggler trying to handle customers who keep bouncing off them.
These customer service response time benchmarks by channel help you set service level agreements (SLAs). They ensure that a rep isn’t constantly rushed through queries.
Nextiva’s survey of 400 consumers sets these new customer service response time benchmarks: Chat: One minute; Phone, SMS, or ticket response: Within five minutes; Email: Within 30 minutes
There are various other channels. Here’s an overview of what customers expect and what teams actually deliver.
What Counts as a Response Time
Response time is the time it takes a human or AI to respond to a customer query. Auto-acknowledgements like “We have received your email, and will respond in 24 hours.” don’t count. The response needs to be about the query that a customer raised.
A few metrics often show up when talking about response time, such as first response time (FRT), resolution time, and average speed of answer (ASA).
- FRT is the elapsed time between the moment a customer reaches out to you and a human or AI responds for the first time.
- Resolution time runs until the customer’s issue is solved.
- Average speed of answer (ASA) quantitatively describes the average time it took for a call to be answered by an agent from the point when the caller first selected the option to speak to an agent.
FRT and resolution time have notable gaps for many companies.
Now let’s look at some current customer service response benchmarks to understand what’s acceptable and what may be cause for concern.
Customer Service Response Time Benchmarks by Channel
These customer service response time benchmarks (from Nextiva’s study, unless otherwise noted) let you set targets to deliver services per the service level agreement for each channel. It helps you set and manage customer expectations better.
| Channel | What customers expect | What teams deliver | Recommended starting target |
|---|---|---|---|
| Phone | Immediate response within 5 minutes; 54% hang up within 8 minutes on hold | 80/20 service level is the long-standing industry convention | 80% answered in 20 seconds; tighter (90/15) for urgent or premium lines |
| Live chat | Instant responses, within about 1 minute | Varies widely by staffing; measure your own median | First human reply under 60 seconds while chat is shown as available |
| SMS/text | Response within 5 minutes | No reliable cross-industry benchmark published | Under 5 minutes in staffed hours; after hours, auto-reply with a stated time |
| Response within 30 minutes | 12 hours 10 minutes average; 62% never replied (SuperOffice, 1,000 companies) | Under 1 business hour for urgent, same business day for standard | |
| Social media | 73% expect a reply within 24 hours | Varies by platform and staffing | Same business day; faster for public complaints |
| Tickets/web forms | Response within 5 minutes | Tracks email performance at most companies | Match your email SLA, with priority tiers (see below) |
Phone
Most call centers use 80/20 as the baseline, which is a widely accepted benchmark. However, its weakness lies in the 20% of callers who wait longer than 20 seconds, with no limit on how long they’re supposed to wait.
If you’re aiming for top-notch service on the phone, you might want to measure service level, abandonment rate, and longest wait. This gives you a complete picture of your phone service.
Live chat and SMS
Expectations are tight for live chat. If your chat widget on the website says online, customers read that as a promise of an instant reply. As a benchmark, aim for 1 minute or less in your replies. If there are no agents that can respond in a minute, switch to an AI-first greeting that states a wait time.
When staffing your support team, account for the share of chat interactions that escalate to phone support for resolution.
For SMS, customers expect a reply within five minutes. Target this during office hours. For after-hours text messages, send an automated reply with a stated time.
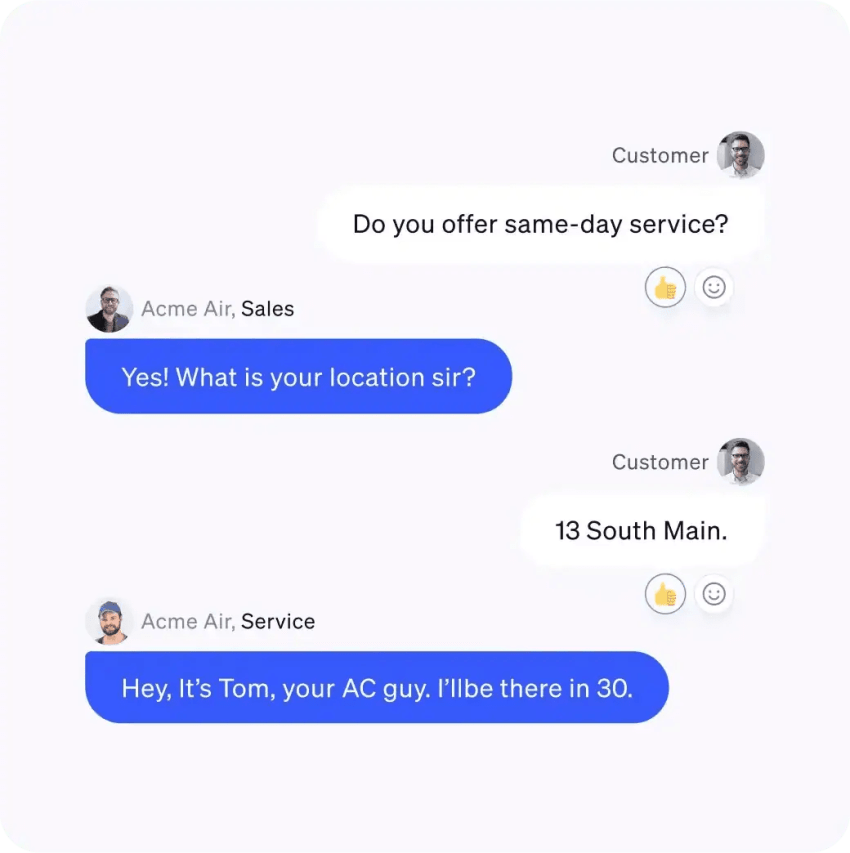
Most companies respond to emails more slowly than customers expect. Usually, companies set an SLA to respond in one business day, but that’s far from what customers expect. Nextiva’s customer patience benchmarks show that customers expect a response time of 30 minutes for email.
For complex queries, if you can get it to a same-business-day email standard, that would separate you from most of the market.
Social media
Complaints made publicly stay public. Everyone gets to read them. Even though the 2025 Sprout Social Index sets the expectation at within 24 hours, it helps if you aim for sooner.
Same-day response is achievable for most teams. The differentiator is how fast you get to the angry or difficult customers.
How Customers’ Expectations Shift by Industry and Urgency
Urgency shapes customers’ expectations more than industry does. In Nextiva’s Customer Patience Study, 77% of respondents said the urgency of their issue is the single biggest factor of how patient they will be.
For example, a customer whose card was declined at checkout would expect a faster response than a customer who needs to change their display name.
There are three examples that show a similar trend:
- Healthcare and financial services: These customer inquiries typically come in as urgent, regulated, and phone-first. They often run tighter customer service levels such as 90/15 for phone responses.
- E-commerce: Order-status volume spikes with promotions and holidays: The query around “Where’s my order?” becomes more urgent during Black Friday promotions and Christmas.
- B2B SaaS: SLAs are set based on the severity of inquiries. More severe issues like account blocks or unblocks increase in urgency, and customers expect them to be handled promptly.
Urgency does change customer expectations. Think for yourself: If your air conditioning broke, wouldn’t you expect the vendor to take care of it as quickly as possible?
How to Calculate First Response Time in Customer Service
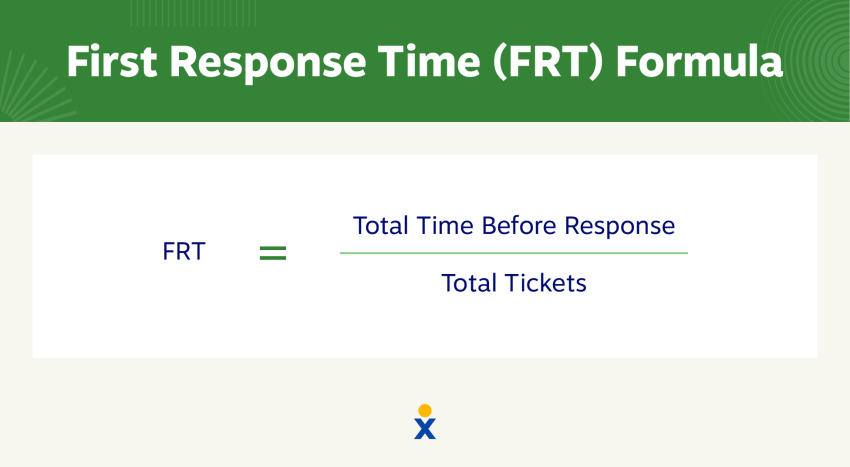
If you’re calculating first response time per ticket, the formula is:
FRT = total time before response ÷ total tickets
The reply can be from a human or AI, but it needs to be contextual.
Now, when you calculate the average first response time across tickets, the formula becomes:
Average FRT = sum of all FRTs ÷ number of tickets
For the phone, first response is calculated with this formula:
Service level = (phone calls answered within the threshold ÷ calls offered) × 100
If you end up excluding abandoned calls from “calls offered,” your service level rises every time a caller gives up. Include abandoned calls after a short threshold of 20 to 30 seconds, so a misdial doesn’t count.
For other related formulas, look into this guide to customer service metrics.
When measuring first response time over a period of time, you can’t always trust the average. For example, if five tickets got answered in two, three, four, five, and 120 minutes, the average would be 26.8 minutes. But this isn’t what most customers experienced.
To understand what most customers experience, it’s better to look at the median instead of the mean. In some cases, like during peak hours, the median may not reflect a typical first response time. Zondacrypto experienced just that when its median first response time reached 31.7 hours.
You also need to mention whether you consider calendar hours or business hours in your SLAs. It’s best to put it in your contracts so customers are on the same page.
Here’s a quick overview of how you can easily read an FRT report.
| Measurement choice | Why it matters | Recommended setting |
|---|---|---|
| What counts as first response | Auto replies can make response times look faster than they are | First human or AI reply that addresses the question |
| Where the clock stops | An internal note or time entry is not a reply | Stop when a reply is sent to the customer |
| Headline statistic | One slow ticket can skew the mean/average | Use the median, and track the 90th percentile too |
| Clock | Overnight and weekend hours distort email and ticket queues | Use business hours for SLAs; report calendar hours separately |
| Abandoned calls | Leaving them out can make service levels look better than they are | Include calls abandoned after a short threshold and document them |
Balancing First Response Speed With First Contact Resolution
Response speed is easy to optimize in ways that don’t actually help the customer. For first response time, measure not just how quickly a reply was sent, but whether that reply meaningfully moved the issue toward resolution.
Fast wrong answers cost more than slower right ones
A quick non-answer may stop the response-time clock, but it creates another customer interaction and adds unnecessary work for the support team. And don’t count on customers giving you a second chance; 42% abandon a brand after just two poor experiences.
Even if you respond quickly, without a helpful solution it’s still frustrating for the customer. Customer experience (CX) leaders are increasingly asking deeper questions about whether support teams are truly solving the customer’s problem. It should be more about the quality of resolutions.
When you’re tracking customer service response time, it helps to track first-contact resolution alongside it.
Set tiered SLAs by severity
If you set one response-time target for everything, it won’t be sustainable. You can’t expect a quick response for complex support requests.
Tiering helps fix this issue. It’s advisable to write down these tiers to set customers’ expectations accordingly. Below is a template for you to start with. Feel free to adjust for your channel mix and your contracts.
| Priority | Example | First response target | Update cadence |
|---|---|---|---|
| P1: Urgent | Service down, payment failing, safety or health issue | Phone or chat: immediate; email: 15 minutes | Every 30 to 60 minutes until resolved |
| P2: High | Feature broken for one customer, order not delivered | Within one business hour | Every business day |
| P3: Standard | How-to question, account change | Same business day | On resolution |
| P4: Low | Feedback, feature request | Within two business days | As needed |
The “update cadence” column makes SLA templates complete. When a ticket can’t be resolved quickly, consistent communication helps the customer know the team is actively working on their issue.
How to Reduce Customer Service Response Time
These approaches have worked well for some brands to reduce customer response time while still delivering a satisfactory experience.
Offer callbacks instead of hold queues
Customers prefer not to be put on hold. In Nextiva’s customer’s patience study, 75% of respondents said that they’d rather schedule a guaranteed callback than wait on hold. A callback takes a caller out of the abandonment math without lowering service.
However, once you have made a promise to call back, you need to honor it at any cost. A good callback experience gives the customer a clear time window and connects them to a live agent when the call happens.
Here’s a guide to help you configure your callback service the right way.
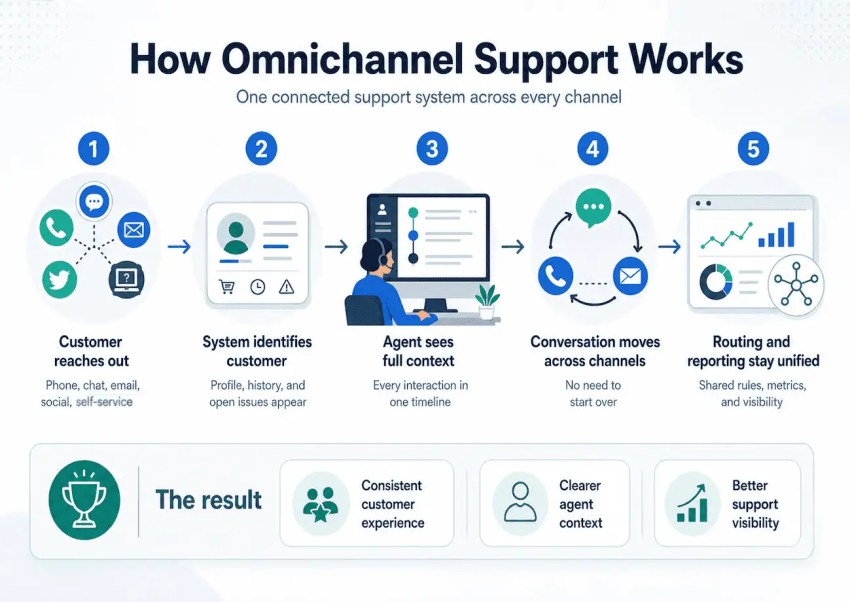
Consolidate inboxes into one queue
When a channel fails, customers do not want to wait. In fact, 56% immediately switch to another support channel when their first choice does not meet their needs. If your system is fragmented, the second attempt becomes a second ticket with no customer history.
This not only forces customers to repeat themselves, but also wastes a second agent’s time working on the same issue. With an omnichannel contact center, you see both attempts in one record. It fixes the compounding problem. Without consolidated inboxes, every new channel you launch creates a new place for a duplicate ticket to hide.
This guide to omnichannel customer service will show you how to set up a single queue.
Route by skill and escalate on a timer
Skills-based routing sends the question to the agent who can close it, which is how you protect first contact resolution while chasing FRT. In addition, when you set an escalation timer, it flags a ticket while there’s still time to save the SLA.
Most routing rules used by companies are fairly simple and static. They ignore the downstream effect of each decision on the rest of the queue. For example, if you pull the best troubleshooter onto every standard issue, it prevents them from solving more complex issues. As a result, the FRT for severe issues gets messed up.
You can fix this by defining the skill tags, identifying the escalation path with a named owner, and setting the timer for each priority.
This queue management guide can help you with the setup.
Use AI for the first response on routine intents
XBert, Nextiva’s AI receptionist, answers calls, texts, and chats around the clock. It handles routine inquiries from your knowledge base and, for complex issues, captures details and transfers the conversation to your team with full context.
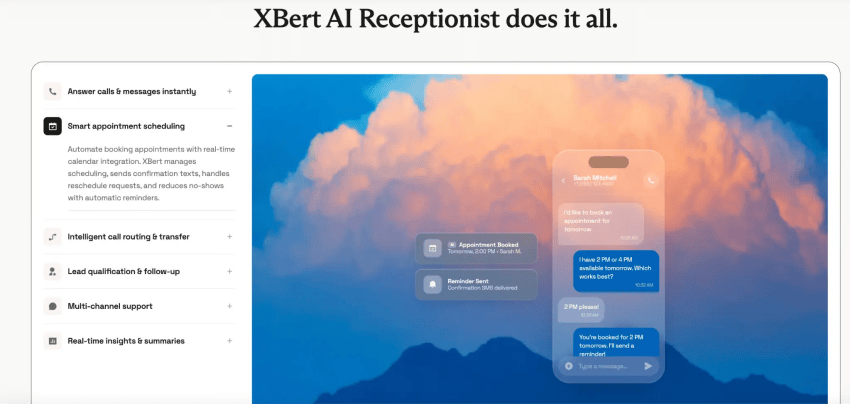
In this case, AI helps determine whether automation shortens or lengthens total time to resolution. It makes sense to automate the inquiries you can resolve end to end (hours, order status, password resets), and hand everything else to a human with the transcript attached.
Count the AI reply as a first response only when it addresses the question.
Staff by interval instead of daily averages
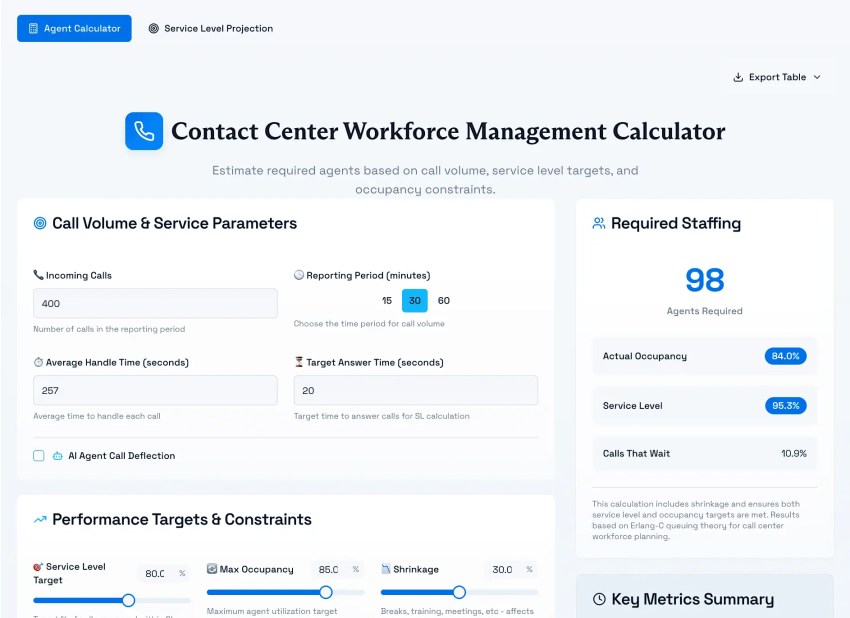
Daily averages for response times can hide short periods when demand spikes and your team falls behind. Staffing by interval shows how many agents you need throughout the day—for example, 30 agents during one time block but 50 during the next—so you can staff to actual demand and protect your SLA.
Some contact centers make staffing decisions in 15-minute intervals. The right interval for your team may be longer or shorter, depending on your call patterns, staffing model, and industry.
These days, typical service calls run for 7 minutes. Use your duration of service calls and queue times to calculate the headcount.
If you need help, use our free contact center staffing calculator.
Hit Your Response Targets on Every Channel With Nextiva
Customers expect faster replies and many businesses fall far short of these expectations.
This gap isn’t because agents aren’t striving to deliver a satisfactory experience as quickly as possible. The gap exists because the agents see six queues instead of one. Agents pick up duplicate tickets from the same customers on different support channels and wind up asking questions the customer has already answered, which hurts customer satisfaction scores.
Nextiva solves this.
Nextiva Contact Center puts phone, SMS, chat, email, and social into one queue, with skills-based routing, in-queue callbacks, and real-time dashboards. Its AI-powered assist and summarization handle the wrap-up work between contacts, which Nextiva customers report cuts agent wrap-up time by 50%.
Nextiva’s AI Receptionist, XBert, handles routine after-hours and overflow inquiries, then passes more complex issues to your support team with the conversation context attached. That way, customers get a useful first response without having to repeat themselves.
Explore Nextiva Contact Center and close the gap between the service your customers expect and the experience they actually receive.
Your AI-Powered Contact Center
Create amazing customer experiences with AI-powered contact center software. Scalable contact center platform built for omnichannel customer conversations.