
 Customer Experience
  Blog
Blog  Business Communication
  Leadership
  Marketing & Sales
  Productivity
  VoIP
VoIP 

If you’re considering wallboard software for your call center, you’re already thinking in the right direction. A well-designed wallboard can be a turning point, bringing real time data to daily performance, helping leaders act faster, and keeping teams aligned around the customer experience.
So why doesn’t every call center use one? Often, it comes down to not realizing how much clarity a wallboard can add (or assuming it’s just a “nice-to-have” display).
You’ll learn why call center and contact center wallboards matter, which metrics are worth displaying, and what to avoid putting on a wallboard where agents can see it.
What is a Call Center Wallboard?
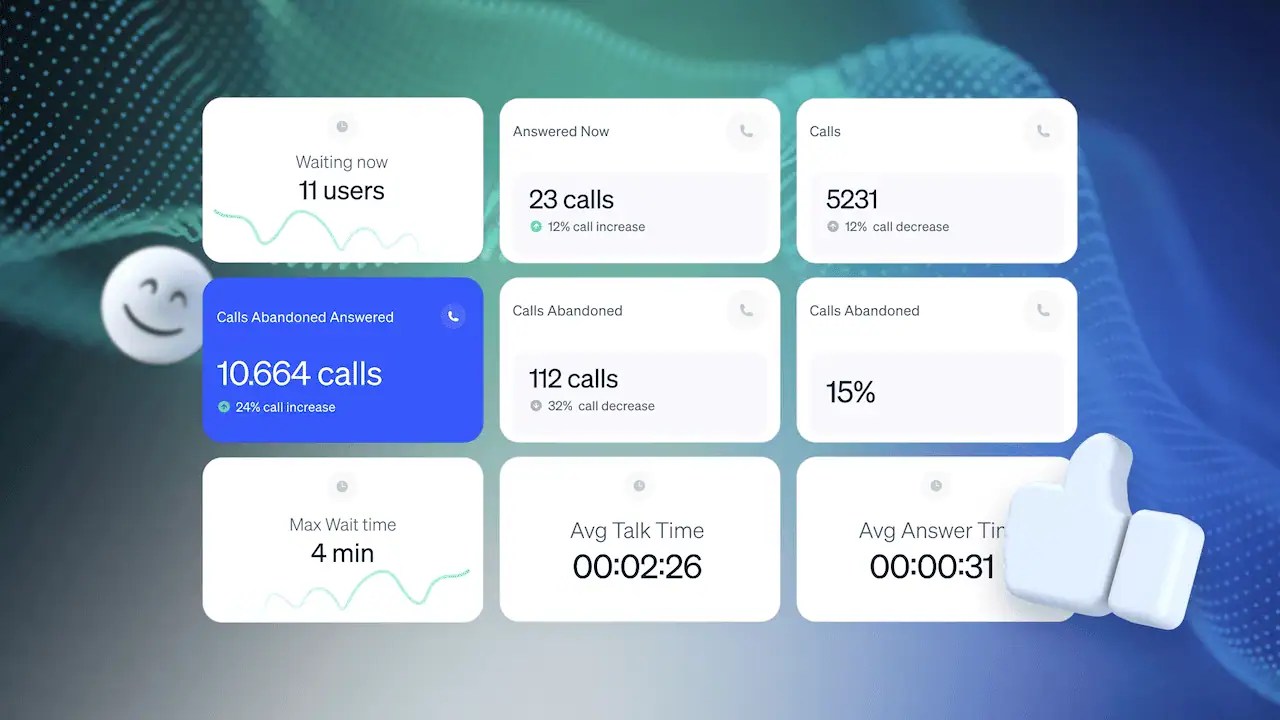
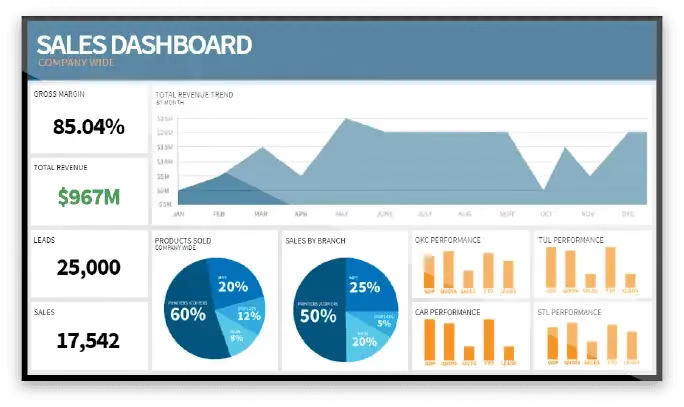
A call center wallboard is a visual dashboard that displays real-time performance metrics and operational data. Teams typically show it on office monitors or shared dashboards so agents, supervisors, and managers can quickly see what is happening across the contact center and improve customer interaction.
It shows metrics such as current call volume, queue length, wait times, and agent availability so teams can understand the health of the queue at a glance.
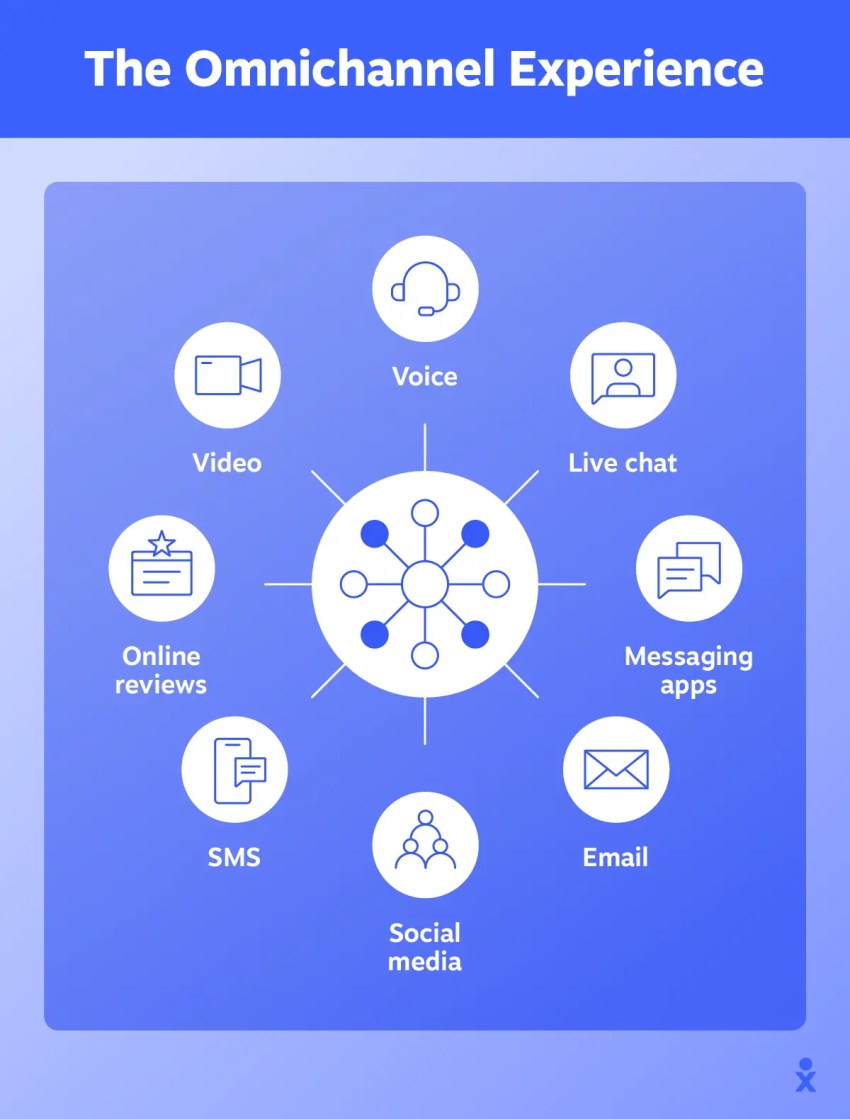
These wallboards pull data from multiple channels, including phone, chat, email, SMS, and social, bringing everything together in a single operational view. This helps teams optimize performance across communication channels, resulting in better operational efficiency.
Wallboard key features
| Feature | Purpose |
|---|---|
| Centralized display | Consolidates data from telephony, CRM, and chat into one screen. |
| Threshold alerts | Uses color-coded triggers (green/amber/red) to signal when action is needed. |
| Role-based views | Customizes data sets for specific audiences (agents vs. executives). |
| Omnichannel sync | Integrates digital channels like SMS and email alongside voice calls. |
| Flexible access | Available via physical monitors, web browsers, or mobile apps. |
Benefits of a Call Center Wallboard / Contact Center Wallboard
Modern wallboards now use AI-driven sentiment analysis and predictive alerts. Instead of only showing what’s happening right now, they also signal what may happen next so teams can respond earlier.
Interactive wallboards give you and your staff a bird’s eye view of everything happening at any given time, which helps managers and agents quickly understand what’s happening across queues, channels, and workloads.
This could be as simple as the number of calls waiting in a queue (so you can think about wrapping up calls quicker or adding more staff to the shift) or more strategic figures like average handle time (AHT) or first call resolution (FCR) that help gauge how efficiently you’re providing customer service.

Here are the key benefits you can expect when adding a wallboard to your call center:
Offers instant visibility into agent performance
Think of a wallboard as the gateway to real time information. Call center managers and supervisors can instantly check on call center performance and identify issues.
By providing a holistic view of what’s happening day to day, senior staff can better facilitate rapid decision-making and responses.
Enables proactive management
When managers can spot issues like increased call abandonment or longer wait times, there’s no need for delays in making changes. You no longer have to wait until you next check your weekly analytics or get your performance report from higher up.
Instead, you can set alerts and notifications for when service levels drop and take corrective action instead of firefighting when it’s too late.
Enhances agent motivation
By visualizing productivity and performance publicly, agents may be more motivated to maintain higher performance levels. After all, nobody wants dropping graphs and red alerts next to their department.
On an individual basis, displaying top performers creates a healthy competitive environment without publicly shaming lower performers. The fight for the top spot is a healthy one, with contact center agents all vying for personal pride or even company incentives.
Encourages transparency
When you display wallboards, you establish transparency, clearly defining expectations and promoting accountability across teams.
It becomes clear to all personnel that they contribute to a wider cause rather than going through the motions in their day job. If your teams are well-incentivized and have a view of how they’re performing as a unit, they’re more likely to react positively when something isn’t right.
Key Metrics to Display on Call Center & Contact Center Wallboards
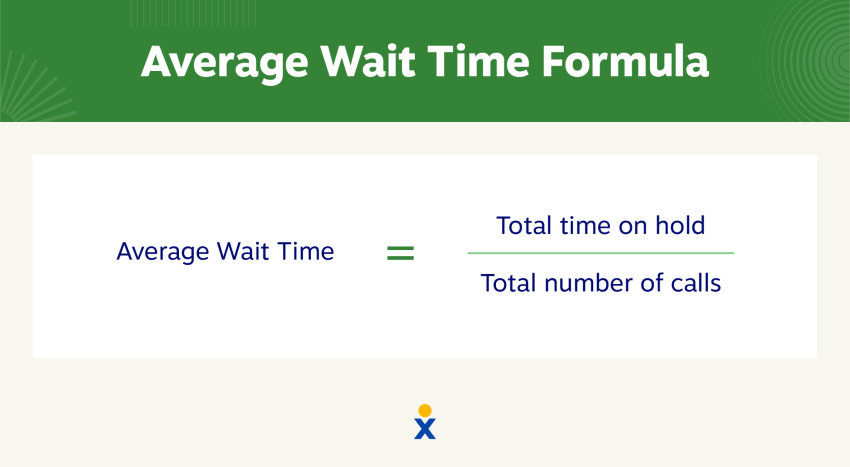
Average wait time
It’s best practice in any call center to prioritize how long callers wait before their call gets answered.
- Impact of display: Agents and supervisors know there’s a bottleneck and can identify the root cause, speeding up the time to answer.
- How agents can influence: Teams can work on techniques to help wrap up active calls more quickly, increasing the number of agents available to handle incoming calls.
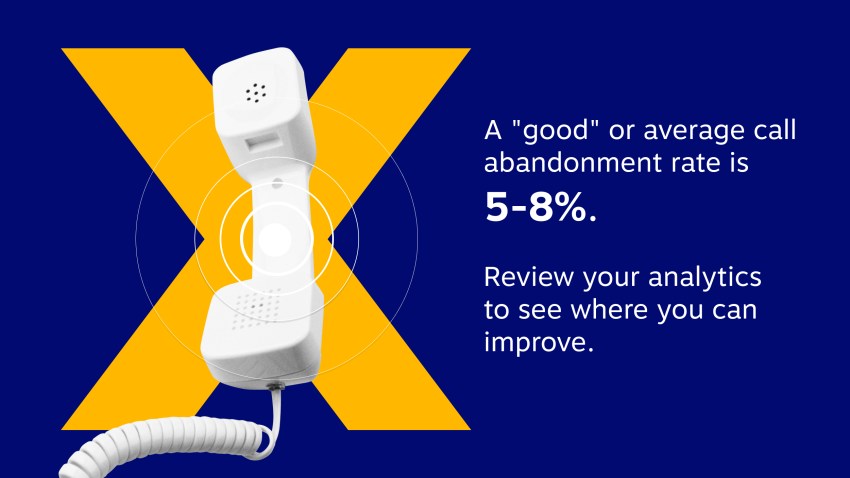
Call abandonment rate
One of the least desirable outcomes in your call center is that a customer or prospect calls in but gives up before they get through to an agent. The abandoned calls rate is the aggregate number of callers who disconnect before speaking to an agent.
Reducing abandonment improves customer experience without increasing operational costs or vendor pricing commitments.
- Impact of display: Agents know they’re missing calls and focus on providing fast resolutions so they become free to handle new inbound calls.
- How agents can influence: When struggling, agents flag that they are focusing on providing quality answers rather than fast answers and need more staff resources during this particular shift.
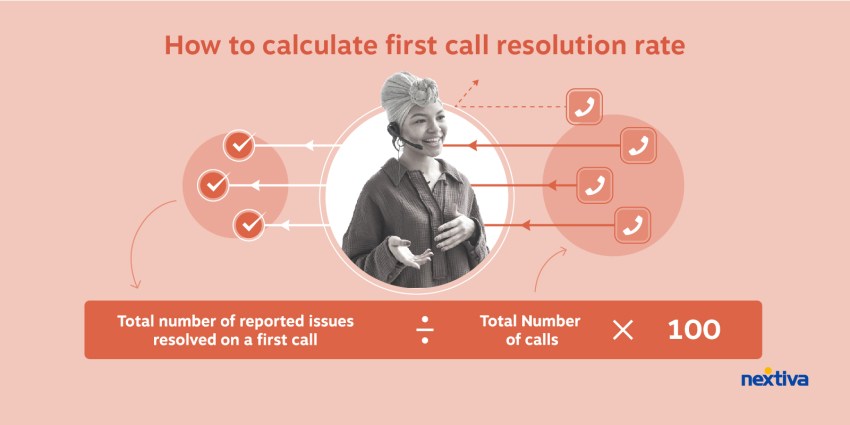
FCR
FCR is closely tied to quality management and measures how often customer inquiries get remedied the first time they call in. When this doesn’t happen, customers must make another call and start the process over again.
This leads to customer frustration because they had to call, queue, and explain their problem once more, and they didn’t get a remedy the first time they invested their time with your agents.
- Impact of display: Repeat callers indicate that agents need to ensure genuine resolution of problems rather than assuming calls are completed with one suggested action for remedy.
- How agents can influence: Agents should quality check the problem has been solved during calls to avoid the same customer calling back with the same issue.
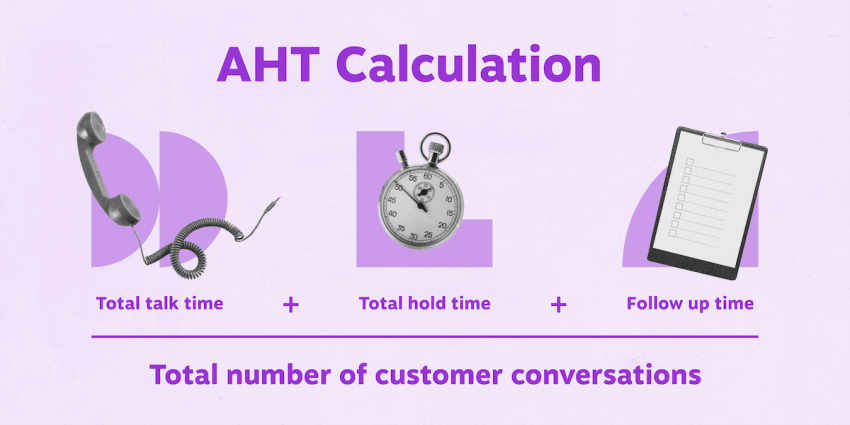
AHT
As one of the most important metrics in your arsenal, AHT shows the average duration of each call, including talk time, hold time, and follow-up time.
- Impact of display: If calls are taking too long, the contact center manager can adjust workflows and identify agents who need extra training to help provide more timely resolutions.
- How agents can influence: If AHT exceeds your threshold, agents can see obvious warnings, focusing on more efficient follow-up time and not allowing excessive holds between queries.
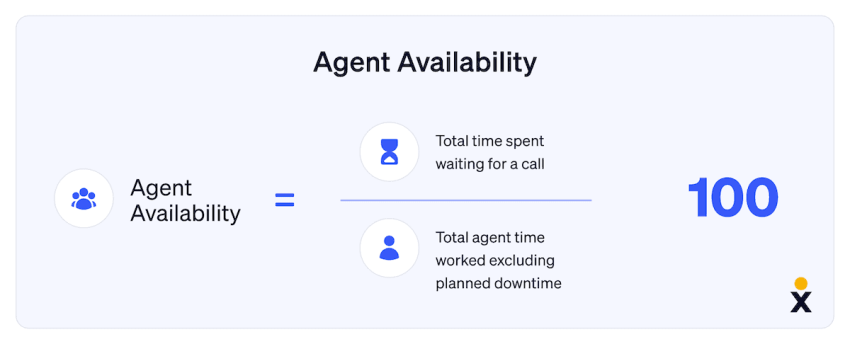
Agent status and availability
Agent status availability displays the current agent availability and shows how many/which agents are taking breaks. It also indicates idle times of agents versus how long they’ve been available.
- Impact of display: Agents know they can’t sit idle when calls are backing up. This drives an environment of being available to maintain company standards.
- How agents can influence: If fewer agents are available than needed, agents working on offline tasks can join the call queue ready to help field phone calls.
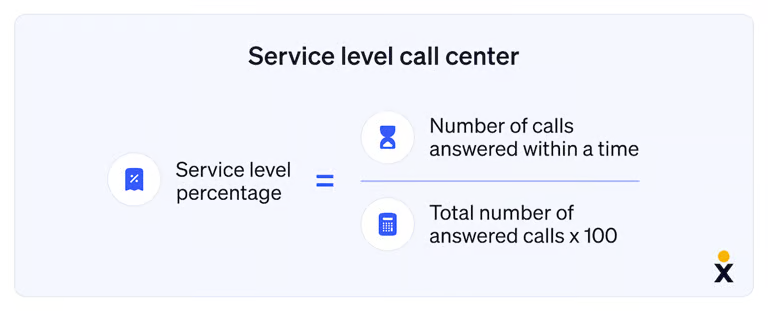
SLA by channel
Each call center should have a desired (or guaranteed) percentage of calls to answer within a set time frame. This may form part of customer agreements or be used as an internal key performance indicator (KPI).
But instead of one generic SLA metric, many modern teams track SLA by channel because expectations differ for calls, chat, email, and social. A contact center wallboard can display a simple “met / at risk / missed” view for each channel (or the % meeting SLA within the target window).
- Impact of display: This indicates a need for alternate workforce management planning or internal training to make more agents available faster. Plus, managers can see which channel is slipping and make an informed decision (shift agents, change routing rules, adjust chat concurrency, prioritize oldest tickets).
- How agents can influence: Agents help protect SLAs by following the right priority order for their channel, keeping statuses accurate (so routing works), and flagging when they need extra support (either staff levels or training to help action queries faster).
Email/ticket backlog
Unlike calls and chats, email and tickets don’t “ring” in real time, but they quietly become a customer experience problem when the backlog grows. A wallboard should show Total Open Emails (by queue/priority if possible) and Backlog by Age so teams know whether they’re keeping up.
- Impact of display: This highlights whether the team is accumulating overdue work and where the bottleneck sits (intake volume, staffing, escalations, or slow resolution). Oldest ticket age is especially useful because it signals risk before SLA breaches become widespread.
- How agents can influence: Agents can reduce backlog by triaging efficiently (tagging and routing correctly), resolving simple tickets quickly, using templates to speed responses, and escalating blockers early so tickets don’t stall in limbo.
Chat wait time
In a contact center, chat can pile up fast, especially during spikes, because agents may handle multiple conversations at once. Displaying current chat wait time and active chats in queue gives teams an immediate view of whether customers are getting stuck before they ever reach an agent.
- Impact of display: The supervisor can spot a developing backlog early and respond (reassign agents, route overflow) before wait times damage CSAT.
- How agents can influence: Keep chats moving by using macros/quick replies appropriately, asking focused, clarifying questions early, and wrapping conversations cleanly.

Sales & revenue metrics
Call center wallboards can also show monetary metrics such as sales volume, conversion rates, or revenue generated per agent in addition to call-based measures.
- Impact of display: This correlates call volumes with sales activity, showcasing the performance of teams and individual agents.
- How agents can influence: By learning what types of calls contribute to revenue generation, agents prioritize specific languages, behaviors, and patterns.
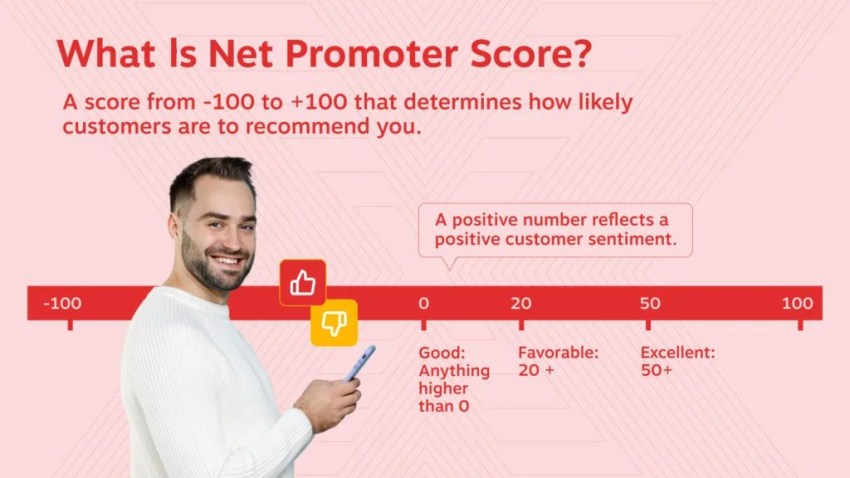
Customer satisfaction score (CSAT) & net promoter score (NPS)
If your business measures CSAT or NPS, display this real-time customer feedback so agents can see immediate responses and know how they are performing on a call-to-call basis.
- Impact of display: Agents know exactly how customers respond to specific language, resolution times, and on-call behavior.
- How agents can influence: Agents can change certain call behaviors, ask for help mid-call, or flag extra training if customers have given a low score following a call.
Queue length
If wait times are excessive, your customers aren’t going to be happy — even if the rest of the call goes well. Choose to display the number of callers waiting, the maximum wait time for the day, and the current queue statuses.
- Impact of display: Staff know whether they’re maintaining a good call answering cadence or whether changes need to be made to rotas, training, etc.
- How agents can influence: If queues exceed an acceptable level, agents can speed up calls if customers are simply chatting post-resolution.
AI-powered sentiment and transcription
Wallboards can also display real-time sentiment and live call transcription for active interactions. Instead of waiting for post-call reports, supervisors can see whether conversations trend positive, neutral, or negative while the interaction is still happening.
- Impact of display: Supervisors move from reactive reporting to real-time intervention. If the wallboard shows several calls trending toward negative sentiment, a team lead can step in immediately. They might whisper guidance to the agent or join the call to help de-escalate the situation and protect the customer relationship before the caller hangs up.
- How agents can influence: Agents can use sentiment indicators as a self-correction signal. If the visual shifts toward negative, they can adjust their tone, use empathy statements, clarify the issue, or request supervisor assistance directly from the interface to help steer the conversation back on track.
Contact Center Wallboard Checklist (+ Alert Thresholds)
Use this contact center wallboard checklist to make sure you’re tracking the metrics that keep calls, chats, and tickets moving. (If you’re voice-only, this doubles as a call center wallboard checklist, focus on the phone metrics.)
- Average wait time (by queue/channel where possible)
- Call abandonment rate (real-time + interval view)
- First contact resolution (FCR) (trend vs target)
- Average handle time (AHT) (talk + hold + ACW, clearly defined)
- Agent status and availability (available / on contact / ACW / offline)
- SLA by channel (calls vs chat vs email/tickets vs social)
- Email/ticket backlog (open volume + oldest ticket age if possible)
- Chat wait time (and chats in queue / concurrency, if applicable)
- Sales & revenue metrics (conversions, revenue today)
- CSAT & NPS (trend, not second-by-second)
- Queue length (contacts in queue by skill/priority)
- AI-Powered Sentiment & Transcription (live pulse indicators showing positive vs. negative interaction trends)
Tip: If this feels like too much, keep all of the above available, but rotate screens by audience (agent floor vs supervisor vs exec).
For a wallboard to be useful, metrics need clear triggers. Setting defined thresholds helps teams understand when performance is drifting and when immediate action is required.
A wallboard is only as good as its alerts. For the metrics above, set clear visual thresholds using a traffic light system. Here’s a simple example of how teams can define warning and critical levels for common operational metrics:
| Metric | Green alert (target) | Amber alert (warning) | Red alert (critical) |
|---|---|---|---|
| Sentiment score | 85%+ positive interactions | 15% of active calls show negative sentiment | 30% of active calls show negative sentiment |
| Queue length | 0-2 Callers Waiting | 5 callers waiting | 10+ callers waiting |
| Wait time | Under 30 Seconds | Exceeds 45 seconds | Exceeds 90 seconds |
When these thresholds appear on the wallboard, supervisors know exactly when to step in. Instead of reacting after service levels drop, teams can rebalance queues, add support, or guide agents before the situation escalates.
Performance Metrics to Avoid Displaying on Your Call/Contact Center Wallboard
They say the more you know, the better off you are. But some things are best left behind closed doors. Here are some metrics you should keep for management eyes only.
Individual error rates
The goal of a contact center wallboard isn’t to highlight who is underperforming in public. Always avoid displaying metrics that may embarrass agents or create negative feelings.
There’s no benefit in public humiliation, so deal with individual errors or shortcomings privately.
Excessive historical data
Real-time metrics are the most effective. Managers, supervisors, and admins can all react when they see data changing in front of their eyes.
Avoid excessive historical data or overly detailed, static reports that can clutter or overwhelm viewers. These tend to cause disruption rather than enhance agent productivity. Leave a wider scope of problem-solving to those tasked with it.
Complex metrics requiring explanation
If it’s not obvious, it doesn’t belong on a wallboard. For complex metrics that need a deep dive and further discussion, leave this to quality assurance analysts and supervisors who know how to manipulate data and deduce potential outcomes of suggested changes.
Metrics should be easily understood at a glance. Avoid overly complex data that requires detailed analysis or interpretation.
Examples of Call Center Wallboards & Contact Center Wallboards by Use Case
Sales call centers
Sales wallboards may display call-based metrics like call abandonment rates and wait times, but the major focus of sales teams is revenue and lead generation.
Display metrics like:
- Daily number of sales
- Daily sales targets vs. achieved sales
- Conversion rates
- Revenue per call or per agent
- Daily revenue
While both types of metrics are important to track, adjusting to a sales and revenue approach means you focus on making money rather than making calls.
Customer support call centers
Focus your customer service wallboards on time to answer, time to remedy, and whether that remedy is a sufficient one so customers don’t need to call back a second time.
Highlight metrics like:
- FCR
- AHT
- CSAT
- NPS
Omnichannel contact centers
For a unified customer experience, introducing non-voice channels (like email, SMS, web chat, and social media messaging) means monitoring and measuring performance outside of incoming and outbound calls.
Unified customer experience management, therefore, must include metrics like:
- Response time across channels (phone, email, chat, social media)
- Omnichannel handle time averages
- Response time comparison
- Channel utilization
- Channel split
Tips for Motivating Performance With Wallboards
Simply turning on a wallboard in your contact center won’t impact your call center strategy. While it will immediately give you real-time metrics, it’s how your team members respond to this information that drives business changes.
Here are four key areas to focus on once you’ve implemented your call center wallboard software.
Embrace call center gamification
Contact center gamification is the introduction of reward systems, badges, or XP progression to encourage agents to hit performance targets consistently. You can use an add-on widget to existing wallboards or create a standalone leaderboard.
The most basic component is a leaderboard to encourage friendly competition. You may also choose to offer rewards (recognition, prizes, extra vacation days, etc.) to motivate consistent high performance.

Highlight positive achievements
Nothing reinforces your faith in an agent like celebrating top performers, milestones, and achievements. Complement your leaderboards with a display of top performers to create healthy competition without causing embarrassment.
Note: Some staff may prefer a “well done” in private. Use situational awareness and get to know your staff before blowing up 20 balloons to celebrate a shy top performer.
Use color and visual cues thoughtfully
An often-missed tip for ensuring wallboards get used is to make use of color coding to highlight key areas needing attention.
- Red for low service levels
- Amber for run rate call answer rates
- Green for achieving targets
Whatever your color scheme, ensure clarity and readability to avoid overwhelming visuals. It’s a good idea to create a template of successful color codes for other departments to replicate.
Set realistic and attainable goals
Rather than shooting for the moon, use your wallboards to track achievable goals that motivate agents positively rather than create stress.
Regularly update those goals to maintain engagement and relevance. If goals expire or become less achievable over time, agents may start to ignore them.
Wallboards for Remote and Hybrid Work
Teams often include a mix of in-office and remote agents. If performance data only exists on a screen inside the office, remote staff lose visibility into what’s happening across the operation. A modern wallboard strategy must give both groups the same real-time insight.
Restoring operational awareness for remote agents
In remote environments, the wallboard usually lives as a secure browser dashboard rather than a physical display. Many high-performing agents keep this dashboard open so they can monitor performance while handling interactions. This approach restores operational awareness that remote agents might otherwise miss.
Contextual awareness
Remote agents do not hear the phones ringing across the room or see a supervisor stepping in to assist. A virtual wallboard restores that operational pulse. Agents can instantly see when queues spike, wait times rise, or service levels start slipping.
Shared performance visibility
A shared dashboard ensures everyone sees the same real-time data. Whether someone works from home or from the office, the entire team operates from the same source of truth. This helps prevent communication gaps between distributed teams.
Creating a shared digital workspace
Remote work can sometimes make agents feel disconnected from the larger team. Wallboards help reinforce a shared sense of performance and progress.
Leaderboards and recognition
When agents see top performers, milestones, or strong CSAT scores in real time, it creates friendly competition and encourages consistent engagement.
Team-level progress
Displaying team metrics helps shift focus from individual activity to collective performance. For example, if agents see the team is only a few calls away from hitting a daily target, they are more likely to stay available and help close the gap.
Enabling real-time leadership from anywhere
Cloud-based wallboards allow managers and agents to monitor performance from anywhere without losing visibility into the operation.
Browser-based access
Wallboards from providers like Nextiva run through a secure web interface, allowing teams to access live performance dashboards from any location.
Mobile visibility for managers
Supervisors can check queue health, service levels, and agent activity directly from a mobile device, making it easier to respond quickly when performance shifts.
Unified CRM integration
Because many contact center platforms connect communication channels with customer data, agents and managers see more than raw metrics. They gain a clearer view of the full customer journey, which helps teams respond with better context and faster resolutions.
Scale Your Contact Center With Nextiva
When you’re thinking about building a contact center wallboard, you need a real-time, data-rich, and easy-to-use platform underpinning it.
By choosing Nextiva’s call center software, you get access to:
- Fully customizable dashboards: Tailor your wallboards to display the exact key performance metrics that are most impactful for your team, driving engagement and productivity.
- An intuitive, easy-to-use interface: Get quick access to critical insights without complex IT support, simplifying decision-making across your team.
- Unified CRM integration: Integrate communication channels and customer data seamlessly, giving agents a complete, actionable customer view with access to the latest API functionalities.
- Real-time, actionable insights: Get immediate access to KPIs, ensuring proactive management and continuous improvement.

Ready to explore the top-ranked AI-powered contact center solution? Check out Nextiva today.
Top AI-Powered Contact Center Solution
Transform your customer interactions with a contact center platform that saves you time and money, reduces agent and supervisor stress, and flexibly adapts to fit your needs.
Call Center Wallboard FAQs
A wallboard is a live performance display, usually on monitors, that shows key operational metrics so teams can react quickly.
A call center wallboard focuses on phone queues and agent states. A contact center wallboard includes calls plus digital channels like chat, email/tickets, SMS, and social, often in one real-time view.
A wallboard is a shared, real-time (more or less) display that shows contact volume, queue health, agent activity, and service performance across channels.
Wallboard software pulls data from your phone system/contact center platform and visualizes key metrics on screens (and often web dashboards), with updates, thresholds, and alerts.
Typical essentials:
– calls in queue/queue length
– average speed of answer (ASA) or average wait
– longest wait time
– abandonment rate
– service level
– agent status/availability
– AHT
– CSAT/FCR
It’s a common service level target: answer 80% of calls within 20 seconds (or a similar defined time window).
ASA is the average time callers wait before being answered. Service level is the percentage of calls answered within a target time (e.g., 80% in 20 seconds).