Nextiva Unity Graphical Dashboard is a Microsoft Windows application, which provides real-time inbound and outbound call statistics for Call Centers, Agents, and custom User Groups. Create custom User Groups to get call summary details outside of the Call Center quickly. Users can quickly access the Dashboard, User Group, Display Template, View, Settings, and About sections from the left panel.
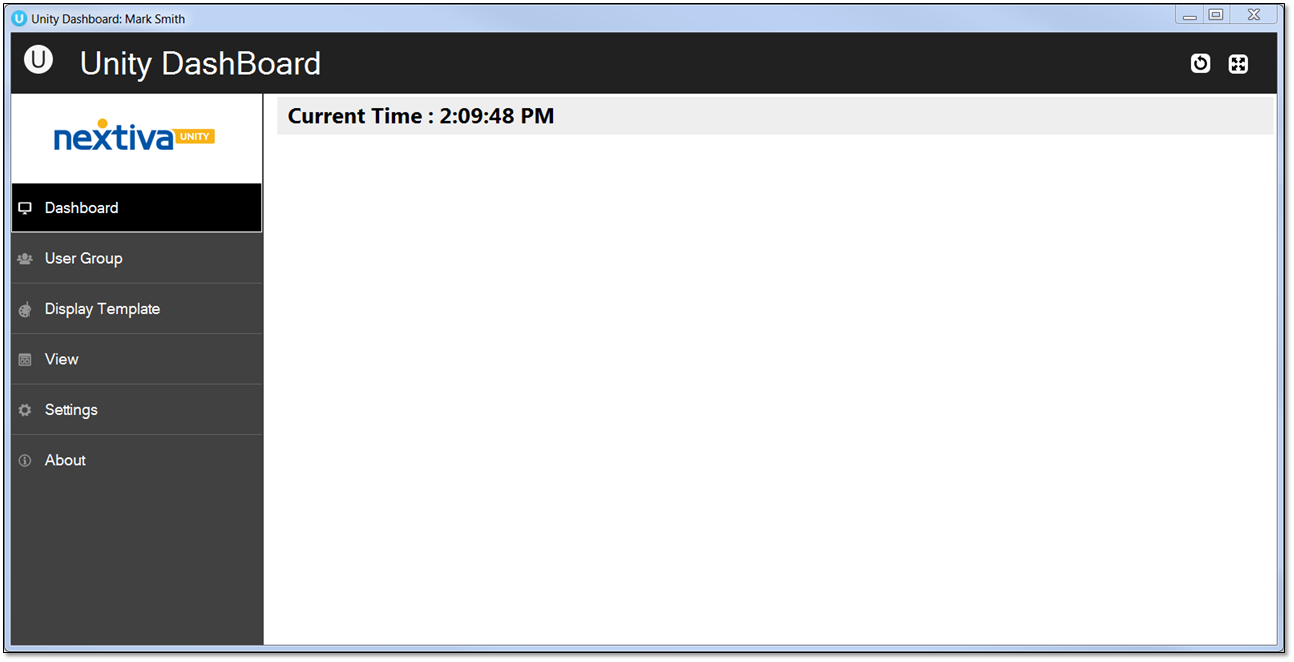 Nextiva Unity Dashboard
- Dashboard: Displays real-time statistics for the desired Call Centers and Agents.
- User Group: Add and remove Users monitored in the Wallboard.
- Display Template: Create display templates and configure Users and statistics shown.
- View: Configure how the templates will be viewed and to which Call Centers.
- Settings: Manage network and authentication details, including configurable settings.
- About: Access Nextiva Unity Dashboard details, such as version and license type.
User Groups
Create User Groups to monitor Agents and Users outside of a Call Center.
- Under User Groups, click the Plus (+) icon to create a new User Group.
- Enter a Name for the new User Group.
- Select the desired User(s) under Available Users.
- Click the right arrow to add the User(s) to Included Users.
- Click OK to save the new User Group.
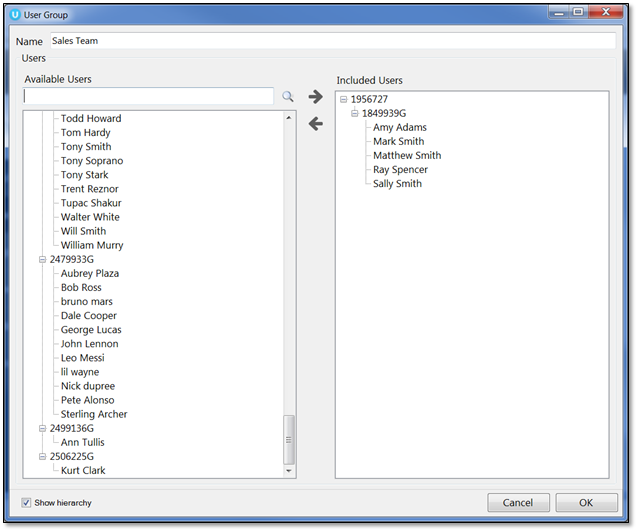 New User Group
Display Templates
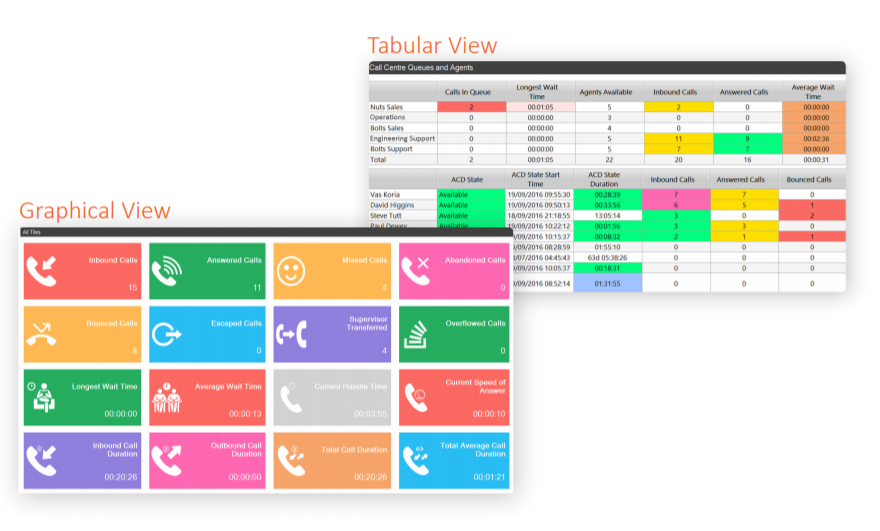
Create and configure tabular and graphical templates that define the grouping of statistics under the Display Template section.
For instruction on how to create Tabular Templates, click here.
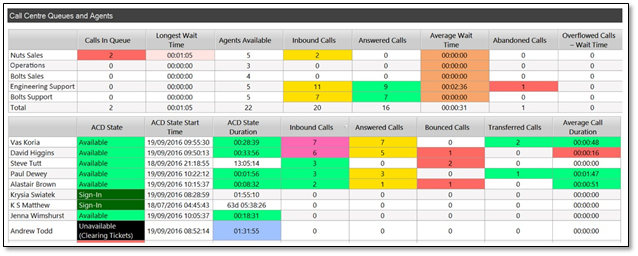 Tabular View
For instructions on how to create Graphical Templates, click here.
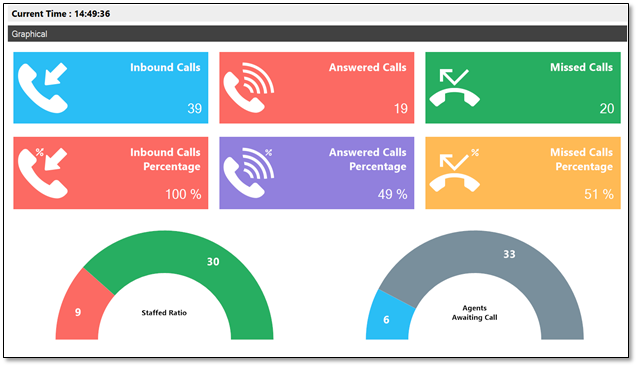 Graphical View
Views
Customize different Views to link the Call Center(s) or User Group(s) data and the statistics configured in the Display Template(s). Views provide the dashboard with the information to display and for how long.
- Under View, click the Plus (+) icon to the right.
- Enter a Name and configure the Display Duration for the new View.
- By default, the Tabular view type is selected, providing all tabular templates created in the Display Template drop-down list. To choose a graphical template, click Graphical and choose from the graphical templates presented in the Display Template drop-down list.
- If using a Tabular template, select the desired Data Source(s).
- Click OK to save the new View.
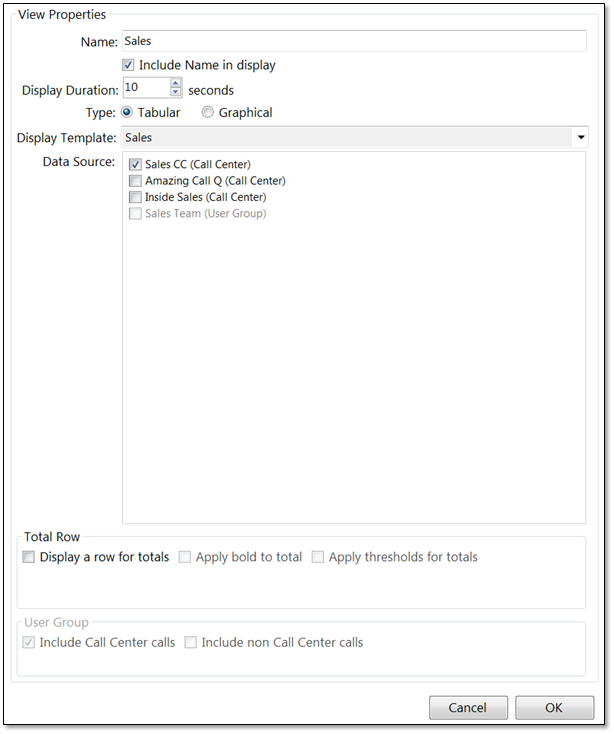 View Properties
All Views created will be listed under Views with the option to re-order them by using the arrows on the right. Users can also delete Views by clicking the minus (–) icon on the right.
Dashboard
The Dashboard displays real-time updates, based on the data source and display templates configured as part of the View. The list of Views will auto-rotate; each view will be displayed according to the display duration set in the View. To skip to another View quickly, right-click on the Dashboard and select the desired View.
For additional assistance, please contact a member of our Amazing Service team by emailing support@nextiva.com to immediately open a case.
Related Articles:
- Installing Nextiva Unity
- Manually Upgrading Nextiva Unity Desktop
- Nextiva Unity Agent Interface
- Nextiva Unity Reception Interface
- Nextiva Unity Supervisor Interface
- Managing Calls from Nextiva Unity
- Managing Call Recording from Nextiva Unity
- Transferring a Call from Nextiva Unity
- Escalating a Call to a Supervisor
- Sending Instant Messages from Nextiva Unity
- Silent Monitoring from Nextiva Unity Supervisor
- Customizing Statistics in Nextiva Unity Supervisor
- Configuring Thresholds from Nextiva Unity Supervisor
- Creating Tabular Templates in Nextiva Unity Graphical Dashboard
- Creating Graphical Templates in Nextiva Unity Graphical Dashboard