Customer Experience
 Blog
 Business Communication
 Leadership
 Marketing & Sales
 Nextiva News
 Productivity
 VoIP

Customer service has become a major driver of loyalty, retention, and long-term business growth. Bain & Company has long linked strong customer experience (CX) with revenue performance.
More recently, nearly one-third of U.S. consumers told PwC they stopped using a brand because of poor online or in-person CX. The latest customer service statistics show why service quality matters to both customers and your bottom line.
Even leadership is starting to recognize the impact on profit margins. In Nextiva’s CX Trends study, 89% of CX decision-makers said their executives understood how customer experience contributes to revenue and costs. The study also found 79% said leadership sees CX as a revenue driver rather than a cost center.
We’ve brought together more than 120 customer service statistics for 2026-2027, organized into the same areas business leaders care about most: financial impact, customer expectations, support channels, agent performance, and AI adoption. It combines proprietary Nextiva findings with independent customer service research, including Gartner studies published in November 2026, so you can benchmark your customer service strategies against the latest data.
Other figures have their own dates, regions, and samples. Some studies compare customer-obsessed with non-customer-obsessed organizations, but those labels need clear definitions. We favor primary research and non-competitor sources, distinguish forecasts from measured results, and link the original study wherever possible.
Key Customer Service Statistics for 2026: What the Numbers Show
Updated on November 11, 2026
These customer service statistics explain why CX is a business priority, rather than just another support function.
Customer experience statistics are most useful when they identify the population studied, the time period, and the business measure. These CX customer service statistics combine Nextiva research with independent benchmarks, not a single universal customer average.
Customers expect a balanced mix of AI and human support. A positive service experience requires a connected history, reliable information, and a person when customers need one.
These customer service statistics provide a starting point for service leaders.
Financial Impact of Customer Service
Customer service has become a measurable contributor to loyalty, retention, and long-term revenue growth.
These customer service statistics show why business leaders should pair customer satisfaction statistics with actual customer behavior rather than rely on marketing claims.
- Companies that prioritize customer experience generate 4%–8% higher revenue than competitors. (Bain & Company)
- In PwC’s 2025 U.S. survey, 52% of consumers said they stopped using or buying from a brand because of a bad product or service experience. (PwC, 2025)
- In the same PwC study, 84% of executives said they increased investment in customer loyalty, but 83% acknowledged a need for better tools to identify what drives purchases. (PwC, 2025)
- 29% of U.S. consumers said they stopped using or buying from a brand because of a poor online or in-person customer experience. This figure is not the same as the share who left after one interaction. (PwC, 2025)
- 79% of Nextiva survey respondents said their leadership considers customer experience a revenue driver rather than a cost center. This measures decision-makers’ perceptions, not independently audited revenue. (Nextiva)
What these statistics mean for your business
Customer service is not just an operational expense. These customer service stats suggest that service quality can influence repeat purchases, customer retention, and customer lifetime value. Track both satisfaction and outcomes, and measure whether a positive customer experience correlates with revenue or lower churn, rather than assuming every improvement drives growth. Poor customer experiences measurably reduce business performance.
Key takeaways
- Evaluate how excellent customer service contributes to customer retention and verified business growth, not just whether executives say it matters.
- Measure how customer experience affects repeat purchases, retention, and customer lifetime value.
- Invest in initiatives that strengthen loyalty and reduce customer churn.
- Regularly evaluate the ROI of your customer service improvements.
Customer Expectations and Pain Points
Customers expect fast, effortless, and personalized support. These customer service statistics show that poor customer experiences and slow responses can erode trust.
Strong customer service teams prioritize excellent service across every channel.
- 70% of executives say customer expectations are changing faster than their companies can adapt. (PwC U.S. survey, 2025)
- 81% of customer experience leaders surveyed said consolidating customer data in a single system could improve the customer experience. (Nextiva)
- 87% of customers say access to a human agent is essential when a business uses generative AI for service. Gartner surveyed 3,566 B2B and B2C customers in February–March 2026. (Gartner, August 2026)
- 58% of U.S. consumers are only somewhat or not at all comfortable using AI tools to interact with brands, reinforcing the need for choice and transparency. (PwC, 2025)
What these statistics mean for your business
Customers expect every interaction with your business to be fast, connected, and effortless. These customer service statistics show why customer service teams need shared customer data, clear escalation, and the ability to provide excellent customer service without asking customers to repeat themselves. Improved customer loyalty requires behavior-based evidence.
Key takeaways:
- Reduce response and resolution times across customer service teams, using first-contact resolution as an outcome measure.
- Help support teams reliably access customer information appropriate to their role and permissions.
- Connect front-office and back-office teams around shared customer data.
- Make it easy for customers to reach a human representative when needed.
Customer Service Investment and Organizational Readiness
AI is changing customer service, but customers still value human support for complex issues. These customer service statistics point to the importance of employee education, measurable customer outcomes, and responsible AI agents.
- 47% of companies say their positive view of CX comes from clearly tracking the revenue impact of their CX investments. (Nextiva)
- In 2026, service leaders reported a 38% rise in AI spending compared with only 2% growth in overall service and support budgets. The Gartner sample was 199 leaders. (Gartner, August 2026)
- 81% of Nextiva respondents identified two or more departments as responsible for delivering customer experience, while 73% said back-office functions affect it. (Nextiva)
- 45% of businesses, on the other hand, say they’ve only made minor investments in AI. 36% cite employee resistance as a main reason. (Nextiva)
What these statistics mean for your business
To maximize the return on your CX investments, connect spending to customer outcomes, not just activity. These customer service statistics help business leaders assess service quality, employee training, and shared responsibility across teams. Studies that report improved customer loyalty should identify the survey population.
Key takeaways
- Measure the business impact of your customer experience investments.
- Build shared ownership of customer experience across every department.
- Invest in customer service agents and change management alongside new technology.
- Prioritize AI and CX investments that improve both customer outcomes and operational performance.
The State of Customer Service & Sky-High Expectations
Today’s customers are more informed and less patient than in years past. The latest customer service statistics reflect rising customer expectations for fast responses, connected interactions, and personalized service.
These statistics also show why an excellent customer service experience needs both speed and empathy.
- In 2026, 91% of service and support leaders reported executive pressure to implement AI for customer service. Gartner surveyed 321 leaders in October 2025. (Gartner, February 2026)
- 70% of U.S. executives say consumer expectations are evolving faster than their organizations can adapt, creating pressure to respond and resolve issues faster. (PwC, 2025)
- 85% of surveyed service leaders say they are expanding human agents’ responsibilities as AI changes frontline work. (Gartner, April 2026)
- 90% of CX decision-makers using AI reported challenges with AI-to-human handoffs, including disconnected workflows. (Nextiva)
- 52% of U.S. consumers said they had stopped using or buying from a brand because of bad products or service, according to a 2025 survey. (PwC, 2025)
- The American Customer Satisfaction Index fell to 76.1 (out of 100) in Q2 2026 from 76.9 in Q4 2025. This is a national index, not a contact-center CSAT score. (ACSI, 2026)
- Younger adults report the highest satisfaction (73%), and satisfaction drops with age. This could either mean older consumers have higher expectations or are more frustrated with modern CX approaches. (YouGov)
- For broader trust context, U.S. consumers reported about $16 billion in fraud losses in 2025, including $3.5 billion in imposter scams. These are fraud losses, not costs attributable to customer service failures. (FTC, June 2026)
- AI-centric service organizations were 23% more likely to report delivering personalized experiences than less mature peers, according to Deloitte Digital’s 2026 global contact center research. (Deloitte Digital, 2026)
- Nextiva found 25% of CX decision-makers already used AI-driven personalization, while another 25% planned to adopt it. These were 2024 responses, not measured consumer outcomes. (Nextiva)
- The technology is shifting, too. 75% of service leaders said they plan to move to a cloud contact center to better meet customer needs. (Deloitte)
- On that note, 67% of CX leaders say it’s a lot easier to get approval for CX investments today. (Nextiva)

What these statistics mean for your business
Customer expectations are rising faster than many businesses can adapt. The customer service statistics above show why disconnected tools and slow workflows can create poor customer experiences. Modern service teams need clear ownership and reliable customer data across channels. Phone calls remain important for complex issues.
Key takeaways:
- Remove operational bottlenecks that slow your support teams down.
- Consolidate customer information into a single workspace.
- Personalize interactions using customer data and AI.
- Benchmark your service performance regularly against changing customer expectations.
The ROI of Great Customer Service: How the Numbers Stack Up
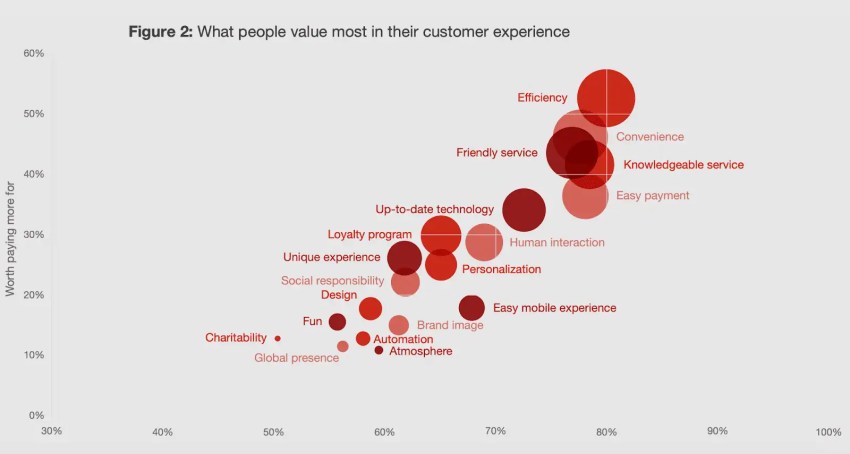
Good customer service brings more than satisfied customers; it also supports loyalty and business growth. These customer service statistics help decision-makers compare customer satisfaction, service quality, and long-term customer value without overstating causality.
To track ROI, you can track metrics like Customer Satisfaction Score (CSAT), Net Promoter Score (NPS), Customer Effort Score (CES), and First Contact Resolution (FCR), or use platforms like Nextiva that come with built-in analytics. They automatically show you exactly how faster responses, fewer transfers, and better conversations translate into higher retention, more revenue, and happier customers.
- The Nextiva survey found 94% of CX decision-makers reported some return from major CX investments over the previous five years, including 58% who described significant ROI. These are self-reported assessments. (Nextiva)
- Contact centers with mature AI capabilities reported 85% greater contact center profitability than low-maturity peers. This is an association between surveyed groups, not evidence that AI alone caused the difference. (Deloitte Digital, June 2026)
- A peer-reviewed study of 5,172 support agents found a 15% average increase in issues resolved per hour with AI assistance. It measures operational productivity, not a direct change in revenue. (Brynjolfsson, Li and Raymond, 2025)
- Just 4% of surveyed customer service leaders said their organizations had achieved their expected ROI from AI initiatives. Gartner surveyed 275 service and support leaders in July–August 2026; this measures AI ROI, not the return on all CX investment. (Gartner, November 2026)
- Among the 440 customer care leaders surveyed by McKinsey, 40% of the most advanced organizations reported significant improvement in customer experience scores over the preceding 12 months, versus 12% of laggards. (McKinsey, February 2026)
- This positive feeling translates directly into advocacy. After a great service experience, customers are 5.1 times more likely to recommend your brand. (Qualtrics)
- Consumers surveyed by Deloitte Digital estimated that they spend 36% more with companies that deliver great service. This is a survey estimate, not verified transaction-level spending. (Deloitte Digital, June 2026)
- The main factors in a review for consumers are: 1. Star rating; 2. Legitimacy; 3. Recency; 4. Sentiment; and 5. Quantity. (BrightLocal)
- BrightLocal’s 2026 survey found that consumers expect recent reviews and increasingly hold local businesses to higher star-rating thresholds. Encourage authentic feedback rather than manufactured five-star ratings. (BrightLocal, February 2026)
- A 2026 survey found that delayed or generic replies to online reviews can undermine trust. Respond to positive and negative reviews with specific, relevant answers. (BrightLocal, February 2026)
What these statistics mean for your business
Great customer service can create long-term business value. Comparisons involving non-customer-obsessed organizations need matched samples. A positive customer service experience is an opportunity to earn trust, not a guarantee of future sales. Customers report different expectations by channel.
Key takeaways:
- Track customer satisfaction alongside retention and revenue.
- Encourage satisfied customers to leave reviews.
- Use customer feedback to improve your products and support processes.
- Measure how customer service contributes to your business growth.

The High Cost of Poor Customer Service
The flip side is that while good customer service strengthens trust, a negative customer experience can damage it. These customer service statistics highlight the risk of poor customer service and the cost of unresolved complaints, including the customers who leave without posting a review.
Through digital channels like social media and instant reviews, a dissatisfied customer’s voice can reach thousands, and the financial consequences can be devastating.
- 29% of U.S. consumers said poor online or in-person CX had led them to stop using or buying from a company, highlighting a measurable retention risk rather than an unverifiable global revenue-loss forecast. (PwC, 2025)
- More than half of consumers surveyed for Deloitte Digital’s 2026 report said their service experience stayed the same or got worse in 2025, despite companies’ investments in service technology. (Deloitte Digital, June 2026)
- Bad CX takes a real toll on customers: 56% said it wasted their time (often 1–2 days), 43% lost money (about $1,261 on average), and 31% said it caused emotional stress. (CCMC)
- 13% of customers have also threatened legal action, and 8% have threatened to contact the media. (CCMC)
- This also means customer frustration is quite high, with 63% of people who had an issue saying they felt angry about the experience. (CCMC)
- 52% of U.S. consumers reported leaving a brand because of a bad product or service experience. This is a different question from abandoning a brand solely because of customer support. (PwC, 2025)
- 29% of U.S. consumers said they had stopped using a brand because of a poor online or in-person customer experience. (PwC, 2025)
- Customers are getting more aggressive as well. 43% said they raised their voice, up from 35% in 2015, and the share of people seeking revenge has tripled from 2020 to 2023. (CCMC)
- In 2023, 32% of people shared their biggest complaint on social media —more than twice as many as in 2020. (CCMC)
- BrightLocal’s 2026 local review survey found that consumers increasingly expect higher star ratings and fresher reviews before choosing a local business. (BrightLocal, 2026)
- Review summaries also matter. BrightLocal’s 2026 report observed growing use of AI tools for local-business recommendations, so clear first-party responses and trustworthy customer reviews both deserve attention. (BrightLocal, 2026)
- Similarly, customers are more likely to buy from your brand if you reply to all reviews (89%) or at least just the negative ones (55%). (BrightLocal)
- 70% of executives told PwC that customer expectations are changing faster than their companies can adapt, reinforcing the cost of unresolved customer problems. (PwC, 2025)

What these statistics mean for your business
Poor customer service can cost sales, drive churn, and damage reputation. These customer service statistics show how a negative customer experience can influence customers long after the original complaint. Use actual churn and complaint data to measure the effect.
Key takeaways:
- Resolve recurring issues before they drive churn.
- Respond quickly to complaints and public reviews.
- Reduce customer effort by improving first-contact resolution.
- Track complaints, churn, and online reputation together.
How Customers Want to Connect: Channels and Preferences
Customer service used to mean a phone number and email address. These customer service statistics show how customers now switch between phone calls, live chat, social media and customer portals. Providing customer service across channels requires clear ownership and access to the same history.
Consumers expect a connected and omnichannel experience, regardless of where they engage. These customer service statistics distinguish channel preferences from resolution outcomes, so customer service leaders can select the right mix.
Phone and human support still matter
- Older adults overwhelmingly prefer the phone, with 50% of them naming it as their top channel. (YouGov)
- Nextiva’s study found 23% of CX decision-makers planned increased phone-support spending for 2025. Treat this as an investment intention recorded in November 2024, not a 2026 spending result. (Nextiva)
- In Nextiva’s research, 23% of CX decision-makers said their companies planned to increase investment in phone support, even as digital channels expanded. The study was fielded in November 2024. (Nextiva)
- In fact, the phone is also the primary complaint channel for most customers, at 50%. (CCMC)
Messaging apps and live chat lead the pack
- Nextiva’s 2025 CX study found that 40% of CX decision-makers planned to invest more in live chat and 29% in SMS, showing demand for flexible digital contact options. (Nextiva)
- In Nextiva’s study, 40% of CX decision-makers expected to invest more in live chat. This reflects organizational investment intent, not consumer preference for one channel. (Nextiva)
- Nextiva found 29% of CX decision-makers planned to increase SMS investment and 27% planned to invest more in in-app messaging. (Nextiva)
- In Nextiva’s November 2024 survey, 40% planned more live-chat spending, 29% SMS and 27% in-app messaging for 2025. These were intentions, not completed investments. (Nextiva)
Self-service and AI chatbots are closing gaps
- A Gartner survey found 49% of customers would have been willing to use a company chatbot if one had been available, yet only 7% used a chatbot or digital assistant during their most recent service interaction. (Gartner, September 2026)
- Brands are also doubling down, with 57% already adopting or planning to adopt chatbots and voice bots in 2026 and beyond. (Nextiva)
- But this is not without challenges. These customer service statistics show why an unsuccessful chatbot can generate customer frustration. In Nextiva’s original survey, 90% of organizations using AI for CX reported human-AI handoff barriers. Companies should measure whether AI agents resolve issues or simply move them to the next channel. (Nextiva)
Social media support is now customer-facing PR
- 21% of customers have spoken about a poor customer support experience on social media. (Qualtrics)
- In 2023, customers posted about their product or service experiences on social media an average of 41 times a year. They also viewed other people’s reviews, posts, and ratings an average of 69 times a year. This is almost double the numbers from 2020. (CCMC)
- Here’s how consumers use social media to find business reviews (BrightLocal):
- YouTube: 34%
- Instagram: 31%
- TikTok: 20%
- Reddit: 20%
- X: 13%
- Threads: 7%
- This also means more than half (56%) of businesses plan to invest in social media for customer engagement in 2026 and beyond. (Nextiva)
Omnichannel support is the new standard
- 81% of CX decision-makers surveyed by Nextiva said customer experience would improve if customer conversations were available in a single system of record. (Nextiva)
- Nextiva found 95% of CX decision-makers reported using multiple customer-experience tools; 13% reported 10 or more. (Nextiva)
- 81% of CX decision-makers believed consolidating customer data into a single system of record could improve CX. This was a reported expectation, not a measured improvement. (Nextiva)
- 25% of brands have also implemented an omnichannel routing engine. 4 in 5 brands have also implemented channel steering strategies, with 36% successfully deflecting calls to other channels. (Deloitte)
What these statistics mean for your business
Customers like to move between phone, chat, email, messaging apps, and social media without losing context. These customer service statistics explain why effective phone support, self-service channels, and a single customer history matter more than adding channels alone.
Key takeaways:
- Offer support on the channels your customers use most.
- Maintain phone support for complex or sensitive conversations.
- Connect every customer interaction across your communication channels.
- Use channel performance data to guide future investments.
Social Media & Customer Service
Social media is a public-facing customer service channel where unresolved complaints can persist. These customer service statistics cover reviews, response expectations and the customer service experience people share with others.
Customers expect brands to be present, responsive, and effective on social media platforms, where every interaction becomes a public performance. The risks are high, but so are the rewards for brands doing it right.
- A massive 70% of customers report having used social media for customer service purposes at least once. (Sprout Social)
- And with Bluesky growing in popularity, the majority of users want brands to use the decentralized social platform for customer service and support. (Sprout Social)
- Customers expect prompt replies on social media, but service teams should set response-time targets by issue urgency, channel and staffing rather than treat one cross-industry percentage as universal. (BrightLocal consumer review research, 2026)
- However, the unofficial gold standard is much faster. Between 39% and 43% of customers define a “good” response time on social media as being under three hours. (NapoleonCat)
- For online reviews, BrightLocal’s 2026 research finds that slow or generic brand responses can signal poor service. Your response should address the specific issue, not just meet a time target. (BrightLocal, 2026)
- The stakes are high for reviews. 93% of customers say online reviews influence their purchasing decisions. (Yelp)
- Video is also emerging as a service channel. 1 in 3 Gen Z consumers have used TikTok to learn about or purchase a product, and they often use the comments section to ask service-related questions. (Adweek)
- The cost of a social media interaction can be significantly lower than a call center interaction — sometimes as low as $1 per interaction compared to over $6 for a voice call. (Qualtrics)
- 76% of customers notice when companies prioritize customer support, and 51% specifically appreciate it when a brand responds to inquiries on social media. (Sprout Social)

What these statistics mean for your business
Every social media interaction can shape how people see your brand. The customer service statistics above highlight the value of social media support, timely reviews, and specific answers. Monitor customer interactions, not just public reply counts. Use these insights to inform service decisions.
Key takeaways:
- Respond quickly to customer questions on social platforms.
- Monitor brand mentions and online reviews regularly.
- Resolve complaints publicly when appropriate and continue sensitive conversations privately.
- Use social conversations to identify recurring customer issues.

AI and Self-Service Adoption
Customers increasingly want to resolve straightforward issues without waiting for a person. Immediate service should not come at the cost of accuracy. These customer service statistics cover AI agents, self-service, self-service channels, and customer portals—but completion matters more than contact deflection alone.
This shift does not mean customers want every interaction automated. They expect self-service to resolve simple issues quickly and provide a clear path to human support when the problem becomes complex, sensitive, or difficult to explain.
- 49% of customers surveyed by Gartner said they would have been willing to use a company chatbot if one had been offered during their recent service interaction. (Gartner, September 2026)
- Yet only 7% of customers actually used a chatbot or digital assistant during their most recent service interaction in Gartner’s February–March 2026 survey of 3,566 B2B and B2C customers. (Gartner, September 2026)
- Nextiva’s CX decision-maker survey found 57% already used self-service chatbots or planned to deploy them in 2025 or later. This measures organizational adoption and plans, not consumer usage. (Nextiva)
- 35% of contact centers surveyed by Deloitte Digital said they were already using agentic AI in their operations in its 2026 global study. Agentic AI is not interchangeable with basic self-service chatbots. (Deloitte Digital, June 2026)
- In Gartner’s 2026 survey, 58% of customers who used generative AI had used it to complete a task on their behalf, not simply retrieve information. (Gartner, August 2026)
- 50% of customers in Gartner’s 2026 research said interactions feel easier when a company uses generative AI, while 87% still consider a human-agent option essential. (Gartner, August 2026)
- After a negative chatbot experience, only 27% of customers said they would be willing to try a chatbot again, according to Gartner’s 2026 customer research. Customers expect customer service to provide a clear route to a person when automation fails. (Gartner, September 2026)
- In Gartner’s February–March 2026 survey, customers were approximately three times as likely to use third-party generative AI in their most recent service interaction as a company-provided chatbot. (Gartner, August 2026)
- In Deloitte Digital’s 2026 research, 64% of surveyed organizations reported higher agent productivity with AI. This concerns assistance for human staff, not a promise of chatbot-only resolution. (Deloitte Digital, 2026)
- Gartner predicted in 2025 that agentic AI could resolve 80% of common customer service issues without human intervention by 2029. This remains a forecast, not an observed 2026 outcome. (Gartner, March 2025)
What these statistics mean for your business
Customers value self-service because it can save time for straightforward issues. These customer service statistics show why self-service portals, searchable knowledge bases, and a clear human fallback should work together.
The best approach combines a searchable knowledge base, AI-guided answers, account-based self-service tools, and simple escalation to a human agent. This gives customers more independence without trapping them in an automated interaction.
Key takeaways:
- Build self-service around the questions customers ask most frequently.
- Connect AI agents to accurate and regularly updated knowledge content.
- Measure self-service resolution, abandonment, escalation, and customer satisfaction.
- Make the transition from self-service to human support quick and clear.
- Use failed searches and unresolved chatbot conversations to find gaps in your knowledge base.
The Rise of AI & Automation in Support
AI is a major driver of automated customer service. The following customer service statistics show both the potential of AI agents and the limits of automation. Providing customer service through a bot works best when a human agent can take over with full context.
If poorly implemented, it leads to customer frustration. The smartest companies aren’t using AI to replace their employees, but to support and empower them.
- 35% of surveyed contact centers already used agentic AI in operations, according to Deloitte Digital’s 2026 Global Contact Center Survey. (Deloitte Digital, June 2026)
- 91% of customer service leaders said executives were pressing them to implement AI in 2026. This is a pressure measure, not proof of implementation. (Gartner, February 2026)
- Gartner found AI spending rose 38% among service organizations surveyed in April–May 2026, compared with a 2% increase in total service budgets. (Gartner, August 2026)
- For organizations lagging in AI maturity, Deloitte identified 53% citing data security and compliance as an obstacle, emphasizing the importance of governance alongside automation. (Deloitte Digital, 2026)
- McKinsey found 42% of advanced customer care organizations had reversed increasing inbound volumes through digital support and call deflection. This is a surveyed-leader result, not proof of faster issue resolution. (McKinsey, February 2026)
- Other benefits of generative AI in CX include improved customer effort scores (57%), higher agent productivity (56%), and more deflection to self-service (47%). (Deloitte)
- Deloitte Digital reported 73% of surveyed organizations said AI had increased customer satisfaction. The finding is based on self-reports, not a controlled measure of causal impact. (Deloitte Digital, 2026)
- Nextiva’s 2025 research found 25% of CX decision-makers were already using AI-driven personalization, and another 25% intended to adopt it. That is a more relevant service benchmark than a video-recommendation statistic. (Nextiva)
- A single failed chatbot interaction can cause lasting friction: just 27% of customers in Gartner’s 2026 survey would try a chatbot again after a negative experience. (Gartner, September 2026)
- A study published in The Quarterly Journal of Economics found AI assistance increased support agents’ issues resolved per hour by 15% on average; results varied by experience and skill. (Brynjolfsson, Li and Raymond, 2025)
- This is also why 51% of brands prefer “autopilot” tools that allow humans to oversee AI interactions, and 44% are choosing agent-assist tools. (Nextiva)
- Nearly half of employees expressed a desire for more formal training and believe it’s the best way to encourage AI adoption. However, more than a fifth reported receiving minimal or no support. (McKinsey)
- Deloitte Digital found agentic AI use in 48% of high-maturity contact centers versus 24% of low-maturity contact centers. The difference is across surveyed organizations, not an adoption-growth rate over time. (Deloitte Digital, 2026)
- Different AI use cases have different outcomes: Deloitte Digital’s survey found 39% of leaders reported lower cost per contact from AI, while 64% reported higher agent productivity. (Deloitte Digital, 2026)
- Gartner predicts organizations that build coordinated AI portfolios will generate twice the business value by 2028 of companies pursuing standalone AI use cases. This is a forecast, not a measured outcome. (Gartner, November 2026)
- Still, the return on investment can be a journey. Only 26% of companies in the early stages of AI adoption report seeing “high value” from their efforts, highlighting the importance of a clear strategy. (Nextiva)
- 89% of respondents also say positive customer service interactions require a balance between automation, AI, and the human touch. (Nextiva)
- Only 21% of customer service and support leaders told Gartner their organizations had cut frontline staffing because of AI, while 7% reported rehiring after earlier reductions. (Gartner, November 2026)
- 50% of surveyed customers said interactions are easier when companies use generative AI, but 87% still considered access to a person essential. (Gartner, August 2026)
- 71% of U.S. adults believed greater AI use would make their personal information less secure in a February 2026 Pew Research Center survey. This reflects perceived privacy risk, not an observed breach rate. (Pew Research Center, June 2026)


Generative AI and real-time personalization
One aspect that customer service reps are really doubling down on with AI is real-time personalization. Instead of using generic replies or rigid scripts, reps are leaning on generative AI to predict intent, tailor responses, and adjust messaging based on customer feedback analysis, sentiment, and context.
According to Nextiva’s 2025 CX Trends report:
- 39% of companies already use generative AI to write to customers (and another 25% plan to in the future).
- 25% are using AI-driven personalization today (and 25% more plan to adopt it).
- 24% are also using real-time sentiment analysis to better respond to customer needs.
When automation fails: balancing tech with the human touch
Customer service automation can speed things up, but it cannot replace humans for complex or sensitive issues. In Nextiva’s CX Trends research, 98% of respondents using AI rated smooth AI-to-human transitions as important, yet 90% reported handoff barriers. These are results from a November 2024 survey published in 2025. (Nextiva)
A big reason: disconnected systems and messy data. When AI tools don’t have access to accurate, up-to-date customer information, they give inconsistent answers, miss intent, or make customers repeat details they already shared. This is also why 51% of the companies we surveyed are choosing “autopilot” models to handle the busywork while still keeping a human in the loop to monitor, correct, and step in when needed. This hybrid approach acknowledges AI’s limits while preserving the speed customers expect.
What these statistics mean for your business
AI is becoming part of modern customer service, but customers still expect human support for complex situations. These customer service statistics show why AI agents should support—not trap—customers. Measure first contact resolution, automated completion, and the customer service experience after escalation.
Key takeaways:
- Use AI to automate repetitive tasks and assist agents.
- Make AI-to-human handoffs fast and seamless.
- Train employees alongside AI implementation.
- Measure AI success using customer satisfaction and resolution metrics.
The Human Side: Empowering Support Teams for Better CX
Agent well-being belongs alongside customer satisfaction. These customer service statistics remind support teams that service professionals need training, usable tools, and a realistic workload to provide excellent customer service.
Brands are investing heavily in upskilling and smarter tools so agents can feel supported and deliver consistently better customer care.
- In April 2026, Gartner reported 85% of service leaders were expanding human agent responsibilities as AI reshaped frontline work. The survey covered 321 leaders worldwide. (Gartner, April 2026)
- Gartner’s July–August 2026 survey of 275 service and support leaders found only 21% had reduced frontline staffing because of AI. Among all surveyed leaders, 7% reported rehiring after previous reductions. (Gartner, November 5, 2026)
- The U.S. Bureau of Labor Statistics projects employment of customer service representatives will decline 5% between 2025 and 2035, while about 289,500 openings per year will arise from worker replacements. This is a workforce projection, not the observed impact of AI alone. (U.S. BLS, 2026)
- Companies that invest in agent career growth hit 23% more of their strategic goals than those that only plan to. (Deloitte)
- Hiring and staff retention are a top priority for most companies, and brands plan to invest 24%–39% of their budget here. (Nextiva)
- 33% of companies are planning to invest more in employee upskilling in 2026 and beyond. (Nextiva)
- Among Nextiva survey participants at organizations using AI for CX, 53% reported significant investments in employee training, guidelines, or related AI-enablement resources. (Nextiva)
- Similarly, 44% of businesses rate AI agent support as a great way to help agents give the best possible support experience. (Nextiva)
What these statistics mean for your business
Great customer experiences begin with supported employees. The following customer service statistics connect agent training, quality assurance, and customer satisfaction to useful employee support. Excellent customer service depends on informed customer service agents, not automation alone.
Key takeaways:
- Invest in continuous learning and coaching.
- Use AI to support agents rather than increase workloads.
- Monitor employee engagement alongside customer metrics.
- Give agents the tools and customer context they need to succeed.

Customer Service Trends & Predictions 2026
Customer service is changing fast. The following customer service statistics and customer service trends help business leaders distinguish practical capabilities from speculation. The customer experience management market includes tools for analytics, self service, agent support and review response.
Proactive and predictive support powered by AI
The future of great service is solving problems before the customer knows there is one. Instead of waiting for a complaint, businesses are using AI and data to anticipate needs. Imagine a carrier automatically rerouting your delayed package and notifying you of a solution, or your streaming service reporting a billing error and fixing it before your card is charged.
Proactive customer service transforms support from a reactive function to a proactive value driver.

Immersive and visual support with AR
For complex or technical issues, text messages and phone calls are sometimes insufficient. Augmented reality (AR) can let a customer show an agent the product or problem through a phone camera, while the agent points to the next step. This may help with hardware, installation, or field service, but the evidence does not support a universal prediction about adoption or resolution-time savings.
The rise of emotionally-aware AI
The next challenge for AI is emotional intelligence. Customer sentiment analysis may help teams identify possible frustration or urgency in a conversation, but it cannot reliably prove what a person feels. A support specialist still needs context and discretion before a sensitive issue is escalated. This protects personalized service without overstating AI capabilities.

The empowered “super agent” with AI copilots
As AI handles simple, repetitive requests, the human agent’s role will evolve. They will become “super agents,” highly skilled problem solvers who exclusively handle the most complex, sensitive, and high-value customer interactions.
AI-copilots and agent assists will provide agents with instant information and context to support them and allow them to focus on critical thinking and building customer relationships. This will make the agent’s work more rewarding and valuable than ever.
Unified customer data becomes non-negotiable
The omnichannel customer experience concept depends on a shared customer profile rather than disconnected channel histories. Sales, marketing, and support teams should be able to reliably access customer information appropriate to their roles, with permissions and consent in place. That gives customer service agents the context they need to reduce repeated questions.
Radical transparency and customer-led communities
Brands will build trust through radical transparency, meaning openly admitting mistakes, publishing how they respond to customer feedback, and actively building user communities on forums like Reddit. Instead of just a personal support ticket, customers can find answers from other experienced users in brand-sponsored forums and third-party review sites like G2, Gartner, Trustpilot, and Capterra.
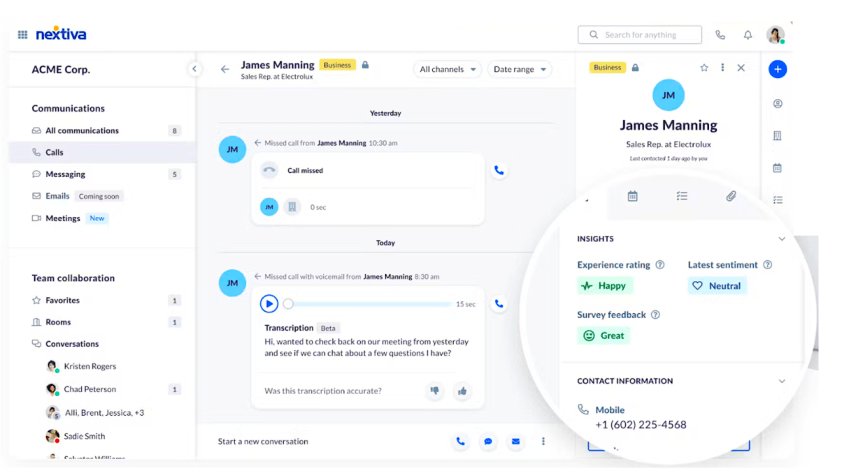
That is why review and reputation management is becoming a core responsibility for CX teams. Modern customer service platforms like Nextiva now include built-in tools to manage reviews, respond faster, and pull that feedback directly into a unified inbox. That way, customer sentiment, issues, and public reputation all live in one place.


Gen AI-driven proactive outreach
AI is pushing CX beyond reactive support and into true anticipation. Instead of waiting for a ticket, brands are using predictive signals to spot problems early, reach out first, and — in some cases — resolve issues without the customer ever noticing.
McKinsey’s 2026 survey of 440 customer care leaders found 42% of advanced organizations had reversed rising inbound volumes through smarter self-service and digital deflection. This supports investment in proactive issue prevention, but does not measure how many teams already use AI for outbound contact. (McKinsey, February 2026)
AI can detect behavior patterns, identify friction, predict needs, and trigger tailored outreach at the right moment and in the right channel.
What these statistics mean for your business
Customer service will become more proactive, data-driven, and AI-assisted. The customer service statistics above suggest that successful customer service strategies combine predictive tools, human judgment and governed customer data. These changes must produce measurable customer outcomes to be credible.
Key takeaways:
- Invest in proactive customer service capabilities powered by AI.
- Build a unified customer view across every department.
- Continue adopting AI while maintaining human support.
- Regularly review customer service metrics and strategy to adapt to changing expectations.

Customer data privacy and security statistics
AI and connected customer service platforms depend on customer data. The customer service statistics here underscore that customers expect brands to protect data and explain how they use it. A positive customer experience must respect consent and trust.
- The FTC reported about $16 billion in consumer fraud losses for 2025. Fraud and impersonation create trust challenges for any brand communicating with customers. This is not a customer-service loss estimate. (FTC, June 2026)
- PwC surveyed 5,511 U.S. adults and 406 executives in 2025 and identified transparency and data handling as important to customer trust. (PwC, 2025)
- 58% of U.S. consumers said they were only somewhat or not at all comfortable using AI tools to interact with brands. It is a measure of AI comfort, not a breach or security failure rate. (PwC, 2025)
- 71% of U.S. adults told Pew Research Center that increased use of AI would make their personal information less secure. The survey reached 5,119 U.S. adults in February 2026 and measured perceptions, not breaches. (Pew Research Center, June 2026)
- The FTC said consumers reported losing $3.5 billion to imposter scams in 2025, including fake brand or agency communications across phone, text, email and social channels. (FTC, June 2026)
What these statistics mean for your business
Customer trust depends on how well you protect personal information. These customer service statistics show why data security and explainable customer outreach matter when a business adds AI agents. Avoid treating fraud-loss totals as direct measures of service quality.
Key takeaways:
- Make data protection part of your customer service strategy.
- Train support teams on privacy and security best practices.
- Clearly explain how customer information is collected and used.
- Review the security of every AI tool and customer service platform.
Turn Conversations into Connections that Drive Loyalty
The takeaway from these customer service statistics is simple: every interaction is a chance to build or lose trust. As customer expectations rise, brands need fast service, accurate customer context, and a reliable transition from AI agents to people. Compare customer satisfaction statistics with your own retention and resolution data before you invest.
And if you’re ready to simplify that entire journey, Nextiva Contact Center brings calls, messages, video, CRM, and AI-powered insights together in one platform. This means better agent productivity, better response metrics, and better customer satisfaction rates.
The NEXT evolution in customer care
See how Nextiva’s NEXT platform helps you build the loyal customer base your business deserves.