How can companies promote teamwork? Teamwork encourages employees to work together and share ideas and best practices.
For example, in a workplace with a mix of both tenured and less experienced sales agents, tenured agents can share best practices with newer agents, while newer agents could offer fresh ideas to tenured agents. In order to stimulate teamwork, companies can hold team-based competitions, where seasoned employees are paired with newer employees. The teams compete for rewards by reaching goals, where everyone on the team must hit all target key performance indicators (KPI’s) in order to win.
Companies can use Nextiva Voice Analytics to create custom groups for each team, then easily track and display progress with dashboards during the competition. For information on creating custom groups, click here.
With custom groups created, managers can configure dashboards to display the progress of the participants.
Visit nextiva.com, and click Client Login to log in.
If logging in from Nextiva Voice (purchased before Dec 2020), select Voice > Analytics.
If logging in from NextOS (purchased after Dec 2020), select Communication > Phone System > Voice Overview > Go to Analytics.
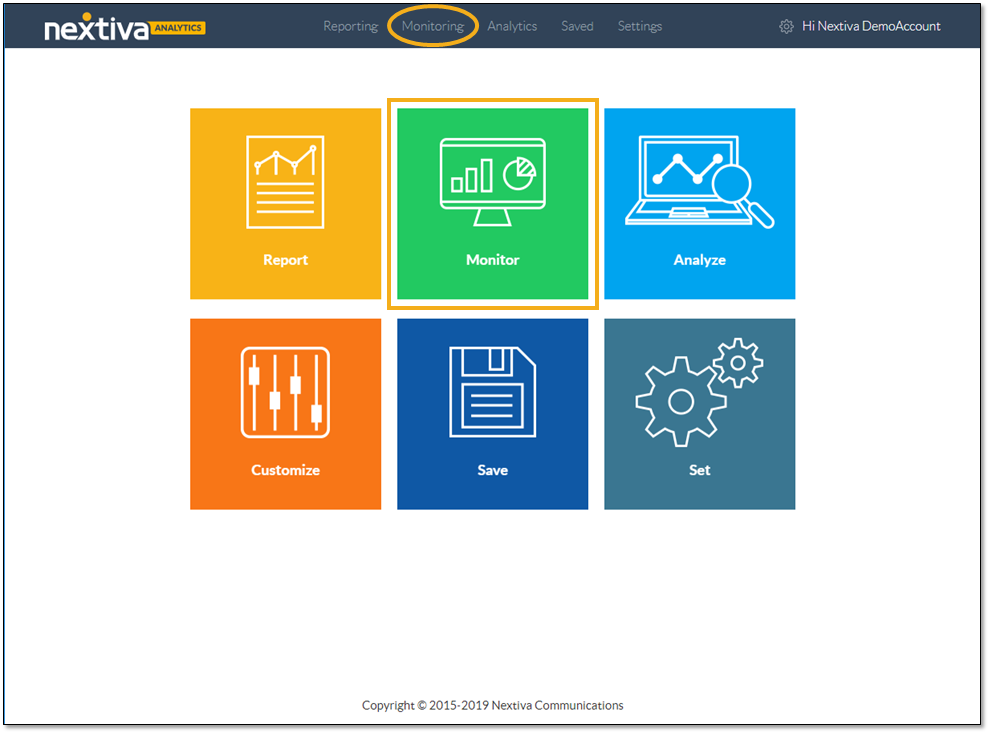
On the Nextiva Voice Analytics Home Page, click the Monitor tile or select Monitoring in the top menu bar.
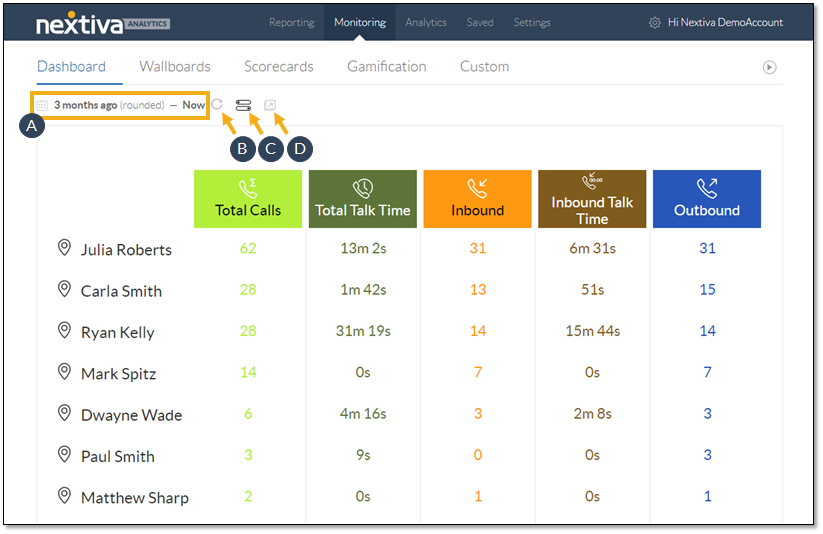
On the Dashboard tab, customize the dashboard:
- Select the desired time range.
- Click to turn real-time data ON (blue) or OFF (gray).
- Click the Slider icon to open the configurator.
- Click to pop out the chart to view it in a separate tab or window.
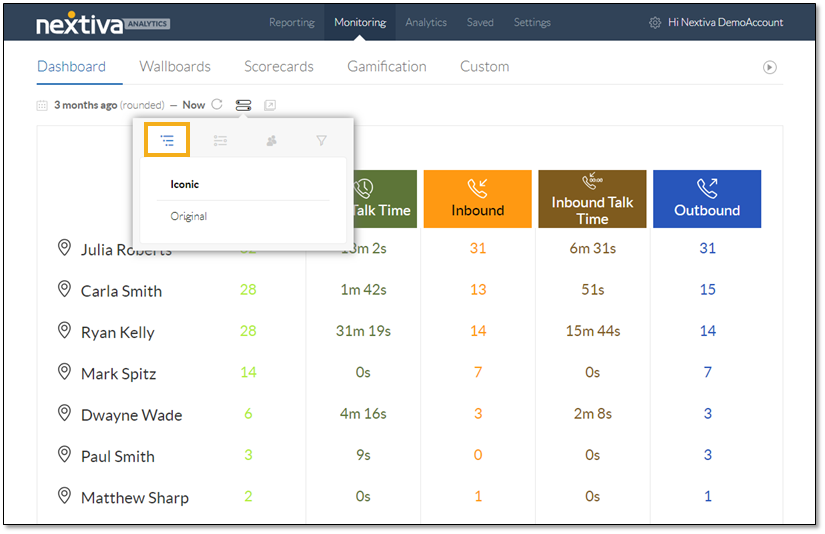
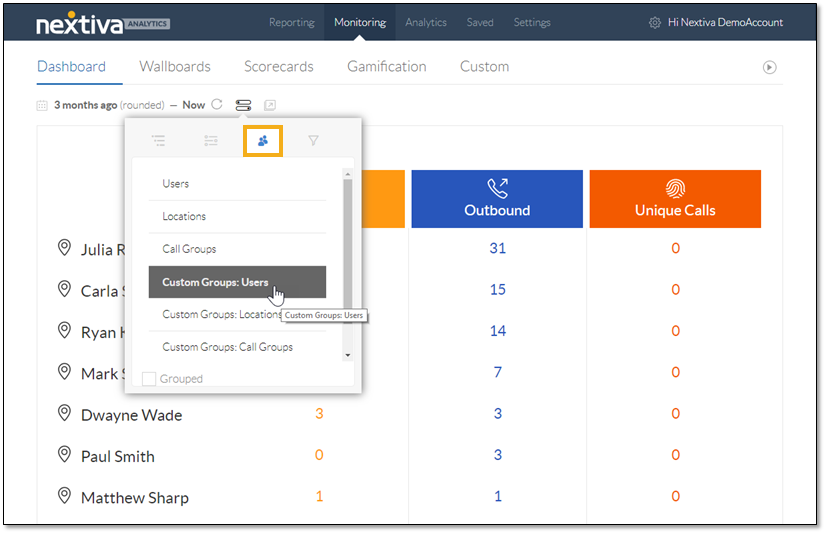
The configurator includes four tabs for customizing the dashboard: Dashboard Type, Metrics, Filter Type, and Filters.
On the Dashboard Type tab, select the desired look for the dashboard.
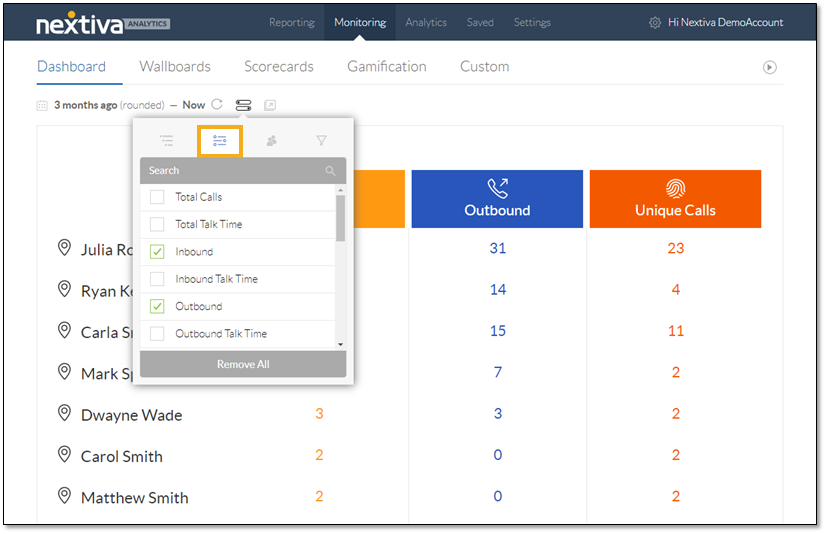
Select the desired metrics on the Metrics tab. For sales teams, important KPI’s include Inbound, Outbound, and Unique Calls.
On the Filter Type tab, select Custom Groups: Users to display call data for custom groups with Users.
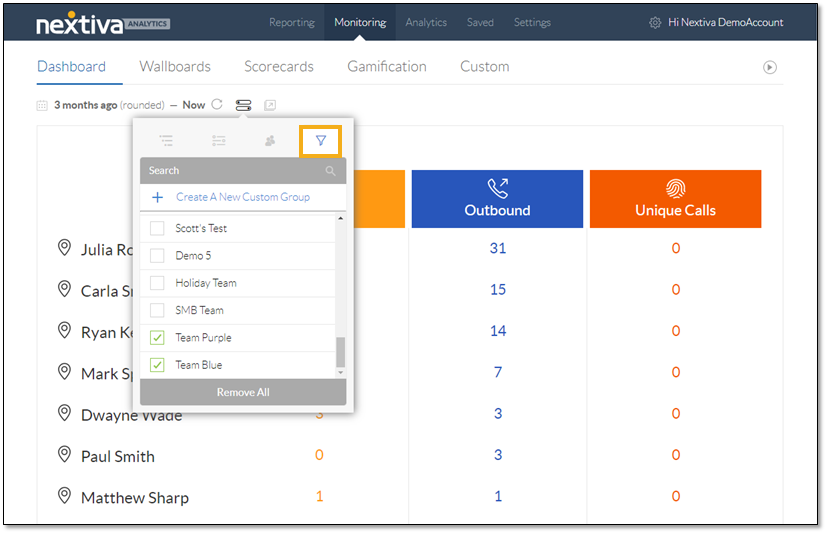
Use the Filters tab to select the specific custom groups to display on the dashboard.
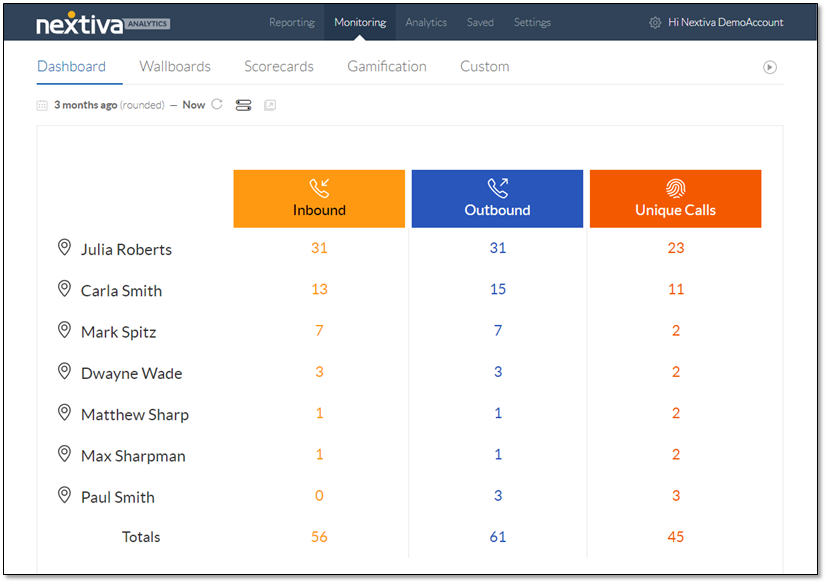
The customized monitoring dashboard displays the call data for each contest participant of the selected teams.
To view the metrics data by team, view the comparison dashboard.
- Select Analytics in the top menu bar.
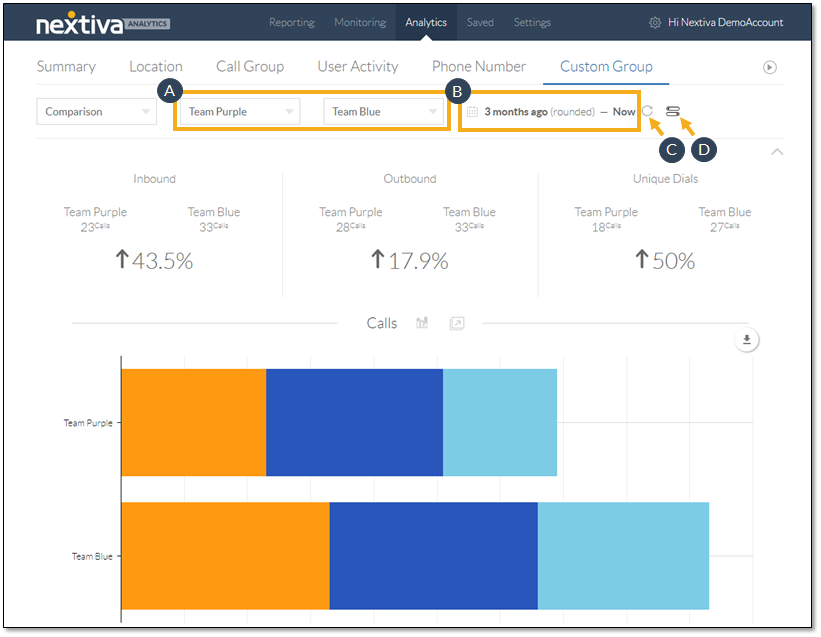
- On the Custom Group tab, select Comparison from the drop-down list.
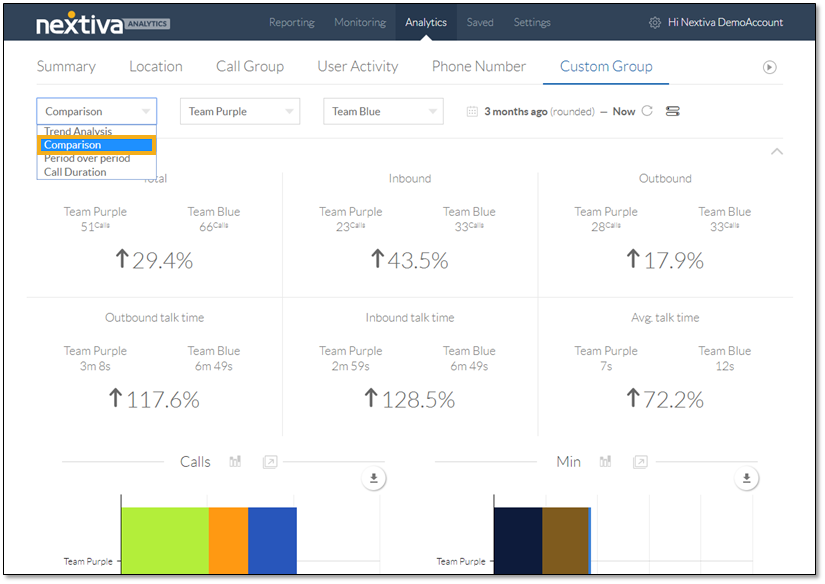
Apply comparison filters to the analytics dashboard.
- From the drop-down list, select the two custom groups to compare.
- Specify the desired time range.
- Click to turn real-time data ON (blue) or OFF (gray).
- Click the Slider icon and select the desired metrics to display on the dashboard.
Displaying both the monitoring and team comparison dashboards during the contest engages the employees and encourages them to work with each other in friendly competition. Fostering teamwork among employees creates a cooperative work environment that contributes to a company’s success.