How can a company determine its staffing needs? Being short-staffed prevents businesses from growing, while being overstaffed can drive up costs.
For example, a company wants to make sure they have enough employees to optimize the potential for growth. One way they can do so is by looking at their missed call data to identify when they need more people on the phones to ensure that all calls are answered to minimize revenue loss.
Using Nextiva Voice Analytics, companies can retrieve missed call data and view the information in various ways.
Visit nextiva.com, and click Client Login to log in.
If logging in from Nextiva Voice (purchased before Dec 2020), select Voice > Analytics.
If logging in from NextOS (purchased after Dec 2020), select Communication > Phone System > Voice Overview > Go to Analytics.
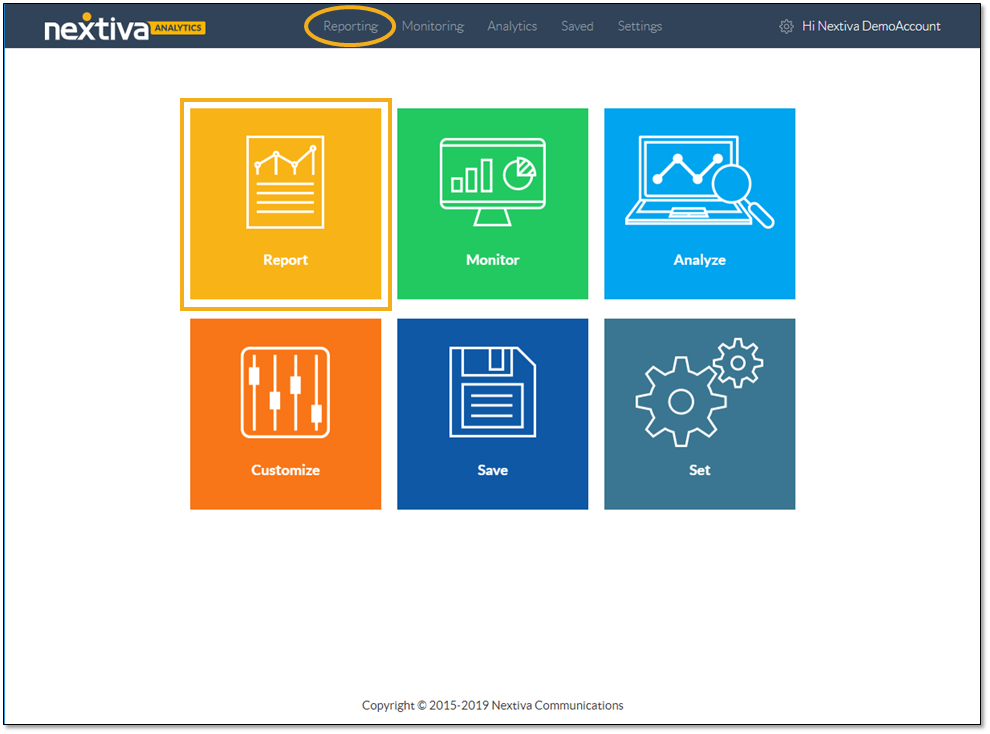
On the Nextiva Voice Analytics Home Page, click the Report tile or select Reporting in the top menu bar.
On the Summary tab, select the desired time range.
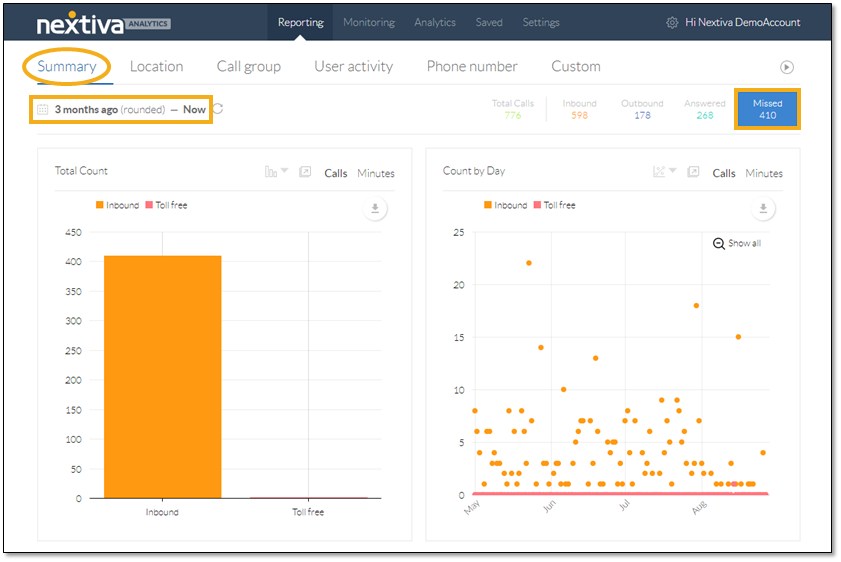
Click the Missed tile to limit the scope of data to include only missed calls.
The Summary tab displays three charts and a heat map:
- Total Count: Shows the total number of missed calls, inbound and toll-free, within the selected time range. Companies can look at this data to determine whether the number of missed calls is acceptable for their business.
- Count by Day: Provides a detailed look at the missed calls data in increments by day. Businesses can easily see what days need more coverage.
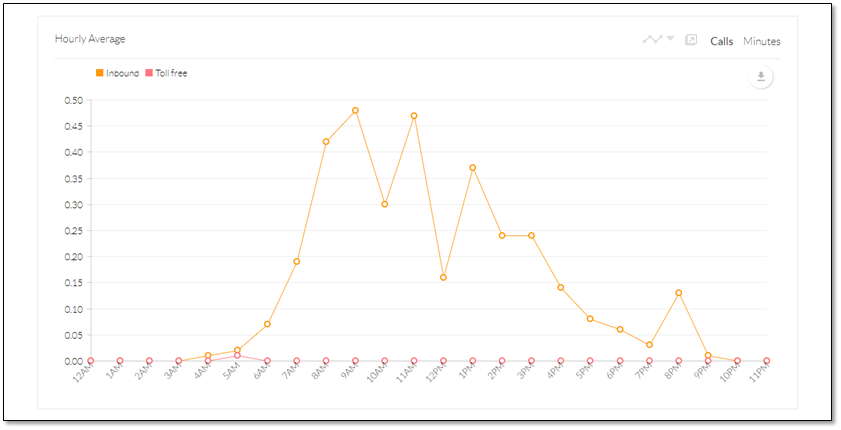
- Hourly Average: Shows an even more granular view of the data by providing the average number of missed calls per hour in a day. This data can help businesses determine their levels of staffing throughout the day.
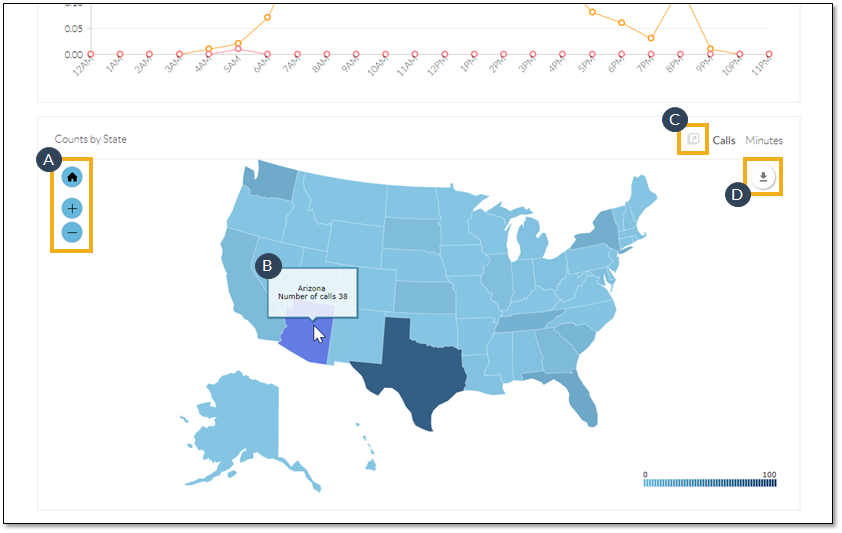
- Counts by State: Displays a heat map that indicates the number of missed calls by state. For companies that operate in multiple states, this map shows which locations may need more staffing.
Users can customize and manipulate the charts to view data in ways that are most useful to them.
- Filter data by clicking a call type to exclude information from the chart. Click again to restore the call type.
- Change the chart type.
- Pop out the chart to view it in a separate tab or window.
- Hover over the chart elements to view details.
- Download the chart as a .pdf file.
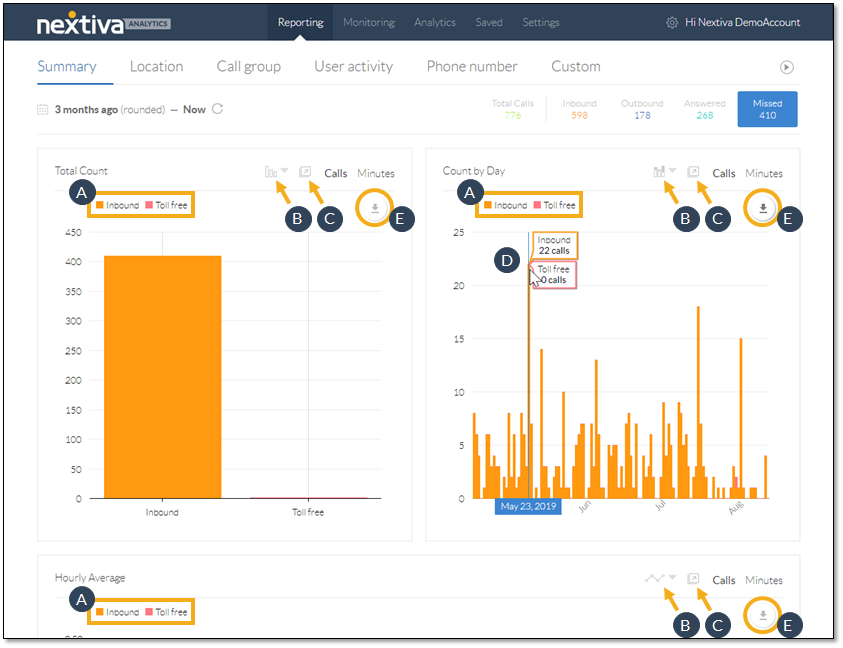
Click-and-drag across the Count by Day and Hourly Average charts to highlight a specific portion for a closer look at the data. Click Show All to restore the chart to its original view.
Users can also customize the heat map to view the data in ways that are most useful to them.
- Zoom in (+) and out (-), as well as click-and-drag the map to get a closer look. Click the Home button to restore the view.
- Hover over a state to view the total number of missed calls for that state.
- Pop out the chart to view it in a separate tab or window.
- Download the chart as a .pdf file.
With Nextiva Voice Analytics, companies can determine how to properly staff their business for maximum efficiency and productivity.