Generate Lead reports to forecast your monthly sales or visualize leads in an organized log for easy access. Lead reports can help businesses understand how to reach a higher conversion rate by foreseeing pain points in Leads by department or Users. These reports will display the total value of deals, probability by stage, agent performance, and more.
- Visit nextiva.com, and click Client Login to log in to NextOS.
- From the NextOS Home Page, select
- Select Reports in the left navigation panel.
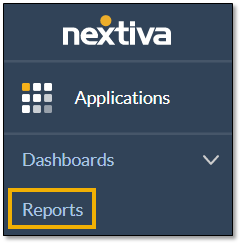
Reports Tab
- In the Reports view, click the Add New Report button at the top-right corner of the page.
- Configure the new report with the Create New Custom Report. For detailed instructions on completing the form, see below.
- To view the results of the report as a one-time report, click Run; otherwise, click Save to make the report available to run regularly.
Completing the Create New Custom Report Form
Completing the Create New Custom Report Form to Create a Lead Report
- Enter a name for the new report; otherwise, Report Title is the default name.
- Select CRM from the Product drop-down list.
- Select Leads from the Entity drop-down list.
- Select the desired Format for presenting the data:
- Aggregate: Totals, percentages, time series, and averages.
- Compare: Groups and comparisons of metrics over various dimensions.
- Lead Log: List of leads with dates, ID’s, and lead owners.
- For the Compare format, define the following parameters:
- Dimension: A field or trait of the leads which can group data (e.g. Users).
- Dimension Value: The dimension’s values to compare
- All: Adds all values of the selected dimension to the report. From the Breakdown drop-down list, select the length of time for the report to compare.
- Custom Selection: Adds specific data to the report. For example, to generate a report on specific Users, select Custom Selection for the dimension value, then select the specific User(s) from the Custom Value Selection drop-down list. From the Breakdown drop-down list, select the length of time for the report to compare.
- Top 10: Displays the top 10 of, for example, Departments with most Leads, top 10 users associated with Leads, and so on. From the Breakdown drop-down list, select the length of time for the report to compare.
- At the top right corner of the preview chart, click the Calendar icon to select the time range.
- Click either the Relative button to specify a relative time range or the Custom button to set a more specific time range.
- Click Update.
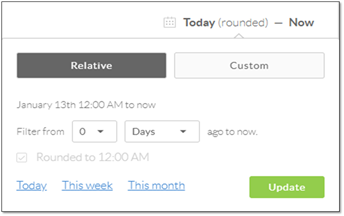
Relative Time Range Selector
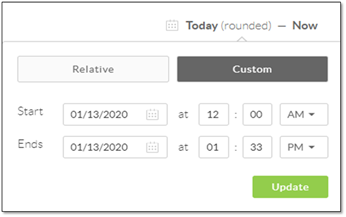
Custom Time Range Selector
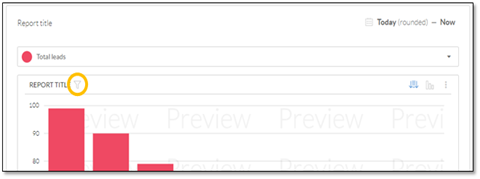
- Select Count from the metrics drop-down list above the Preview Chart. After selecting Count from the metrics drop-down list, click Total Leads
NOTE: The preview chart uses mock data, and as such, the results are not indicative of the actual results after the report is run.
- Select the desired format to display the report by clicking the Chart Type icon at the top-right corner of the preview chart.
- To filter the data in the report to limit the results, click the Filter icon next to the report title above the chart.
Filter Option