In order to offer the best service for customers, businesses must understand the customer experience and previous interactions with the company. By understanding the customer journey—obtaining the knowledge of the customer’s past interactions with the company, their level of satisfaction with products and services, and how they feel about the company overall—businesses can tailor each interaction with them to provide exceptional service.
Nextiva gives businesses insight into the customer journey by gathering analytics data and displaying a 360-degree view of the information to Nextiva CRM Users when they interact with customers.
Users can see the Customer Feedback Trend and Sentiment Trend every time they view the Account or Contact Workspace in Nextiva CRM. When viewing an Account Workspace, Users can also see the Account Experience Score.
- Visit www.nextiva.com, and click Login to log in to NextOS.
- From the NextOS Home Page, select CRM.
- In the left navigation menu, click Account or Contact, then select the desired record from the table.
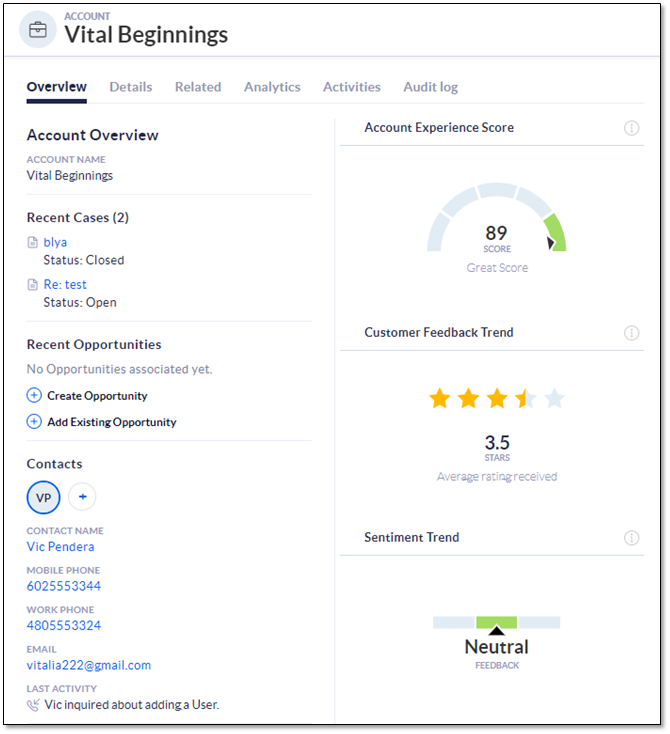
The Overview tab displays a snapshot of the following Customer Journey information:
- Account Experience Score (Accounts only) displays the current experience score of the Account. The experience score is calculated from the points assigned to Case topics (i.e., SmartTopics). For information about SmartTopics, click here.
- Customer Feedback Trend reports the latest outcome of surveys completed by a Contact of the Account. Administrators can configure rules in Nextiva CRM to automatically send a Survey to customers when the status of Cases are updated to Closed or Resolved, for example. For information on managing automation and rules, click here.
- Sentiment Trend shows the customer’s sentiment over time, based on customer interactions. The sentiment trend value is calculated by gathering positive and negative keywords from customer interactions. This can be customized based on customer needs and industry and improves over time with more data.
The Analytics tab offers a more detailed view of the Customer Journey data by including charts that show the score and trends over time.
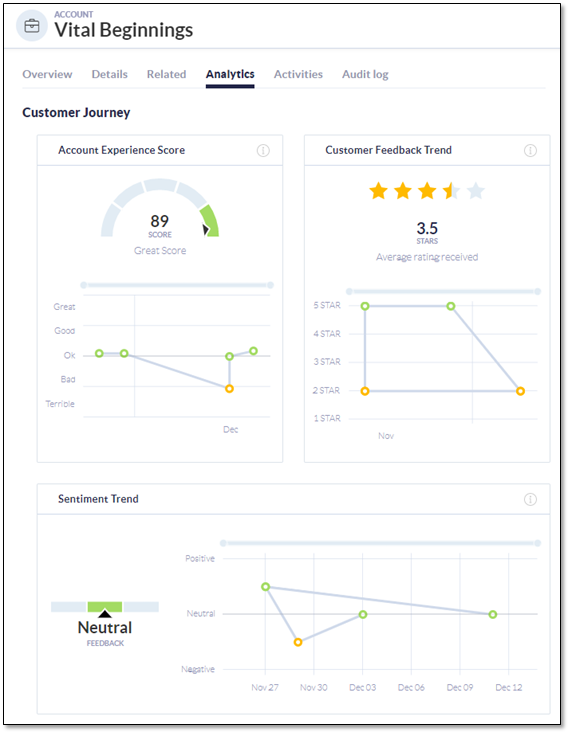
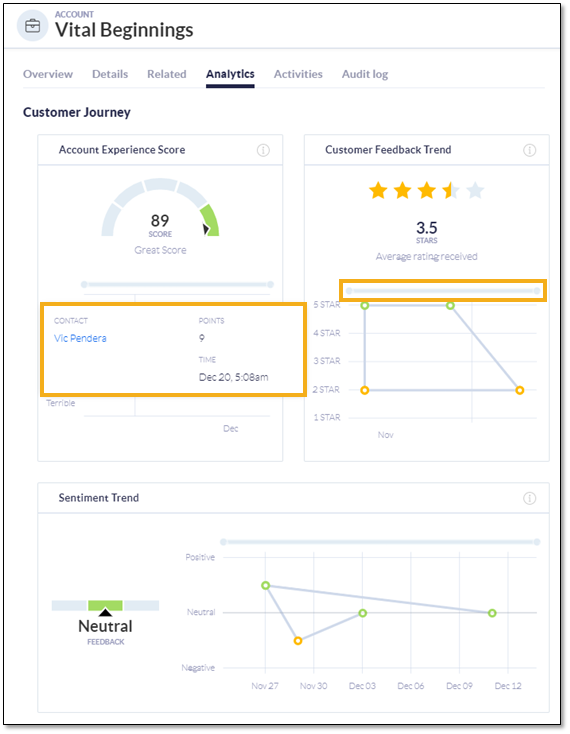
Hover over the data points in any of the charts to view additional information. Adjust the sliders to modify the time range.
Nextiva CRM displays this customer journey information to Users right when they need it—while interacting with customers. By understanding their customer’s overall experience, feedback, and feelings about the company over time, businesses can increase customer loyalty.