Companies that manage multiple locations face the challenge of tracking the performance of each location. Since visiting each location frequently is not very feasible, how can businesses track the performance of each of their locations?
Take a coffee roasting company, for example, with three locations that span two states. It is important for the business to understand the performance of each of the locations. How many calls are coming in with potential orders at each location? How many calls are the sales teams making to proactively earn customers? It would also be helpful for the company to learn which locations are experiencing more call volume so that it can make the necessary changes to optimize success.
With Nextiva Voice Analytics, companies can efficiently create custom reports to track and compare the performance of multiple locations.
Visit nextiva.com, and click Client Login to log in.
If logging in from Nextiva Voice (purchased before Dec 2020), select Voice > Analytics.
If logging in from NextOS (purchased after Dec 2020), select Communication > Phone System > Voice Overview > Go to Analytics.
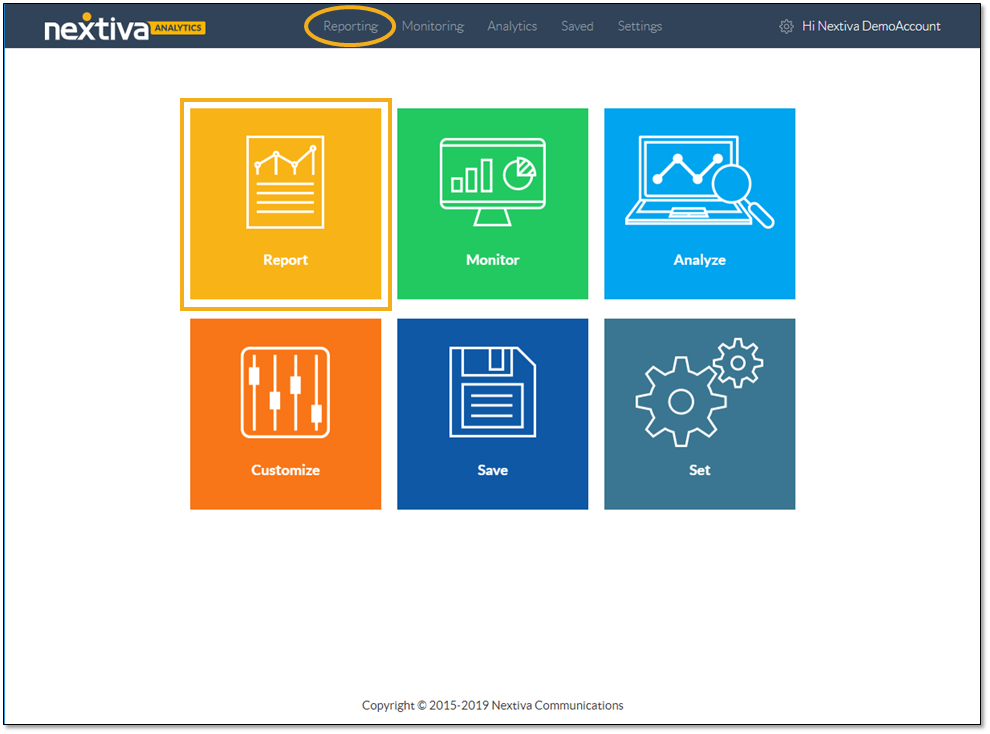
On the Nextiva Voice Analytics Home Page, click the Report tile or select Reporting in the top menu bar.
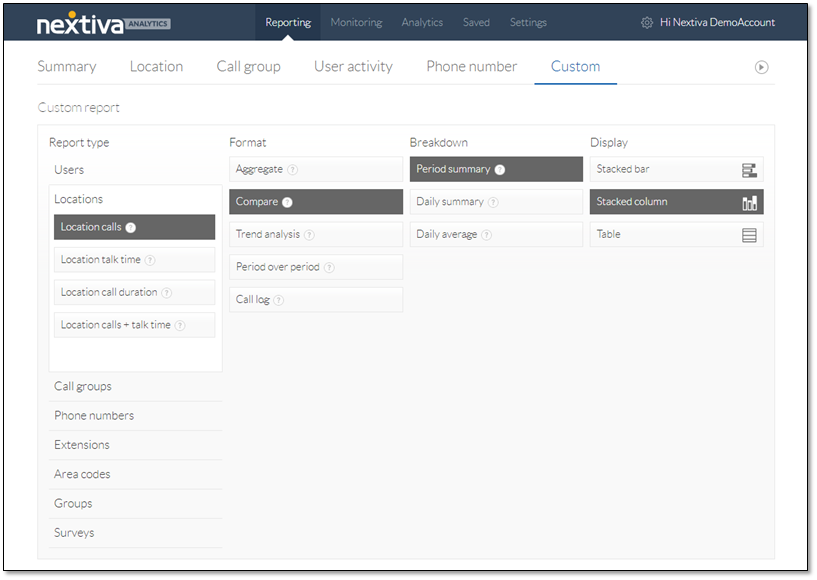
On the Custom tab, select report type Locations > Location calls.
For the report format, select Compare.
Select the desired breakdown (Period summary, Daily summary, or Daily average).
Choose how to display the data (Stacked bar, Stacked column, or Table).
NOTE: The Daily Summary breakdown displays in only the Table view.
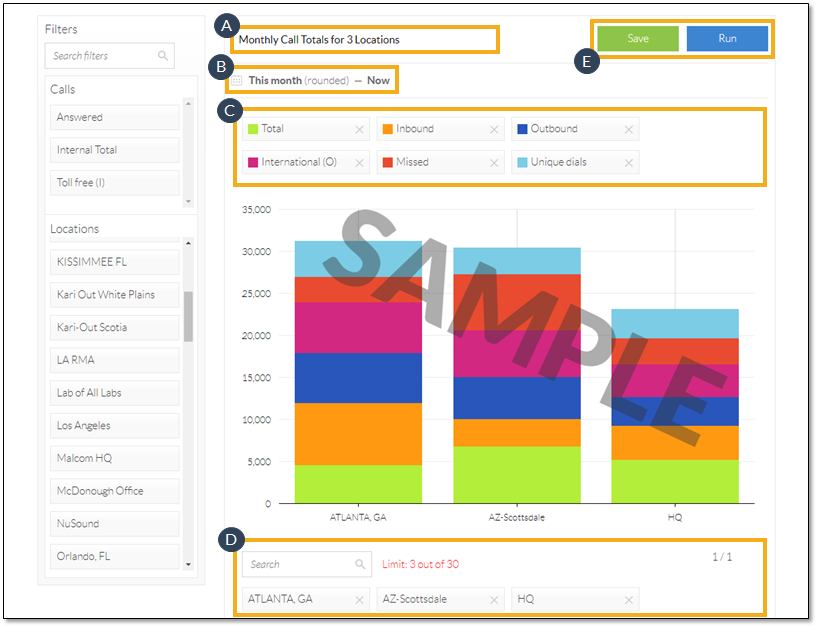
Scroll down to view the sample report and apply filters.
NOTE: The chart shows sample data. Run the report to view the actual data.
- Enter a title for the report.
- Select the desired time range.
- Choose the call types to display in the report. Add call types from the Calls bank in the left panel, or remove them by clicking the X corresponding to the call types to be removed.
- Select the locations to display in the report. Add locations from the Locations bank in the left panel, or remove them by clicking the X corresponding to the location to be removed.
- Click Save to save and run the custom report. Click Run to run the custom report without saving it.
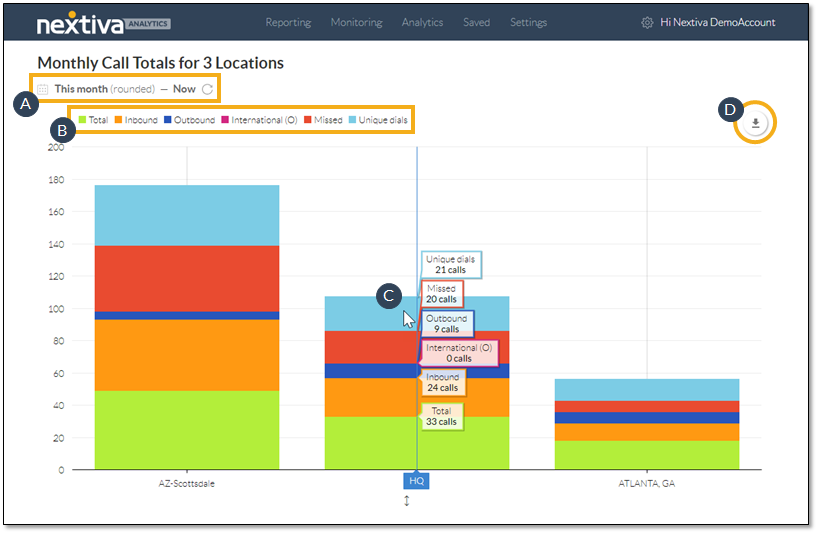
After running the report, users can further refine the data, view details, and download the chart.
- Change the time range.
- Click to remove or restore call types.
- Hover over the chart elements to view more details.
- Click to download the chart as a .pdf file.
With Nextiva Voice Analytics, companies can easily track and compare the performance of multiple locations.