A successful business necessitates building a support team that possesses the skills and knowledge to perform effectively. How can a new company maximize the productivity and efficiency of their support team to optimize customer satisfaction?
Suppose a company has assembled a team of customer support representatives to field incoming calls from customers who need assistance with the company’s products or services. In order to ensure the success of the support team, the company must identify the key performance indicators (KPI’s) by which to measure employee performance, identify objectives, and set expectations.
For support teams, important KPI’s include talk times and the number of inbound calls answered. With Nextiva Voice Analytics, companies can track these KPI’s to drive employee performance and customer satisfaction.
Customers want their issues and requests to be resolved and completed in the shortest amount of time as possible. The lower the talk time, the higher the customer satisfaction. As such, support teams should aim for low talk times. Track talk times with the monitoring tools in Nextiva Voice Analytics.
Customize the dashboard to view the total and average inbound talk times for each support representative.
Visit nextiva.com, and click Client Login to log in.
If logging in from Nextiva Voice (purchased before Dec 2020), select Voice > Analytics.
If logging in from NextOS (purchased after Dec 2020), select Communication > Phone System > Voice Overview > Go to Analytics.
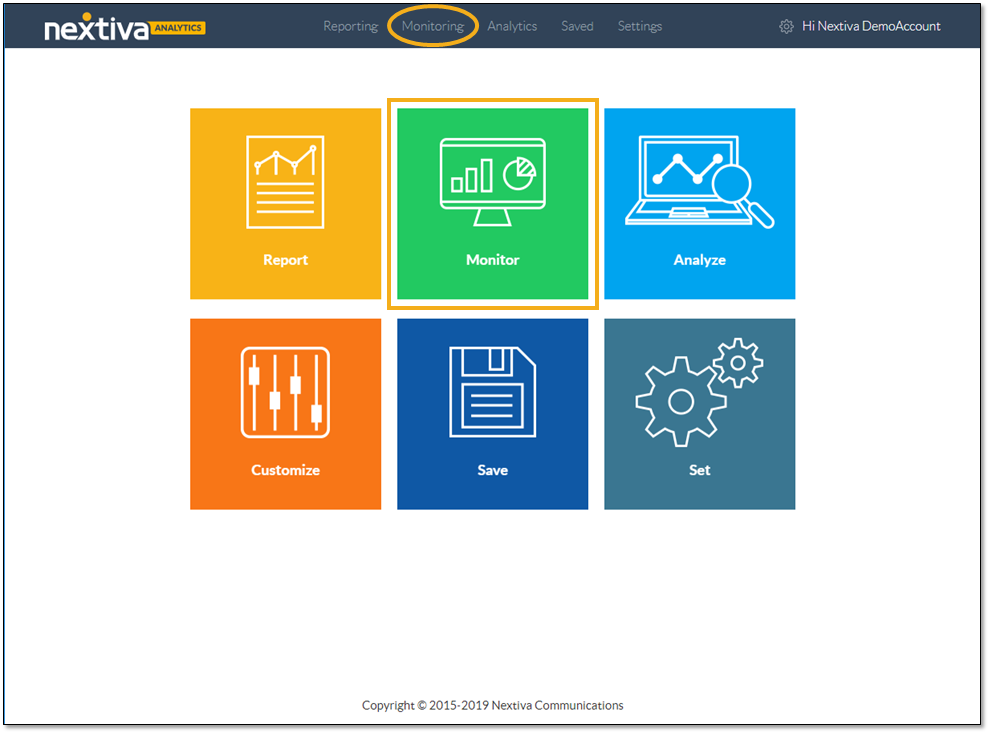
On the Nextiva Voice Analytics Home Page, click the Monitor tile or select Monitoring in the top menu bar.

On the Dashboard tab, customize the dashboard:
- Select the desired time range.
- Click to turn real-time data ON (blue) or OFF (gray).
- Click the Slider icon to open the configurator.
- Click to pop out the chart to view it in a separate tab or window.

The configurator includes four tabs for customizing the dashboard: Dashboard Type, Metrics, Filter Type, and Filters.
On the Dashboard Type tab, select the desired look for the dashboard.

Select Inbound Talk Time and Avg. Inbound Talk Time on the Metrics tab.

On the Filter Type tab, select Users.

Use the Filters tab to select the specific customer support representatives to display on the dashboard.
The analytics dashboard shows the individual performance of the support team for the inbound talk time KPI. Companies can use this data to identify goals and set expectations for their employees.
For example, companies can find the median inbound talk time and set that value as the target goal for their support team. In this example, the analytics dashboard shows approximately 6 hours as the median inbound talk time for the month. The company can then decide to hold the customer support representatives accountable for 6 hours of inbound talk time per month.
The inbound calls KPI is also important for driving the performance of customer support teams. Modify the analytics dashboard to display the number of inbound calls by selecting Inbound on the Metric tab, instead of Inbound Talk Time and Avg. Inbound Talk Time.

The analytics dashboard above displays the total inbound calls taken by each support representative during this month. Companies can use this data for not only tracking purposes but also for setting performance goals. For example, companies can calculate the average number of inbound calls the support team takes in a month and set a slightly higher number as the target goal for their support team to reach in the next month. In this example, the analytics dashboard shows that a support representative takes an average of 167 inbound calls in a month. The company can set answering 170 inbound calls as the goal for each representative to reach in the next month.
When companies set goals for their employees and hold them accountable, the employees feel engaged and motivated to perform better, which contributes to the success of the company.