What can companies do when a team underperforms? Many companies form multiple teams that perform the same function, but one team might fall behind.
For example, a healthcare company employs customer service representatives to answer inquiries and contact patients about billing and insurance claims. The representatives are grouped in teams, and a particular team has had trouble performing as well as the other teams.
Companies can use Nextiva Voice Analytics to compare the metrics of a high-performing team with those of a low-performing team. They can then set the metrics of the high-performing team as the goals for the underperforming team to achieve.
Visit nextiva.com, and click Client Login to log in.
If logging in from Nextiva Voice (purchased before Dec 2020), select Voice > Analytics.
If logging in from NextOS (purchased after Dec 2020), select Communication > Phone System > Voice Overview > Go to Analytics.
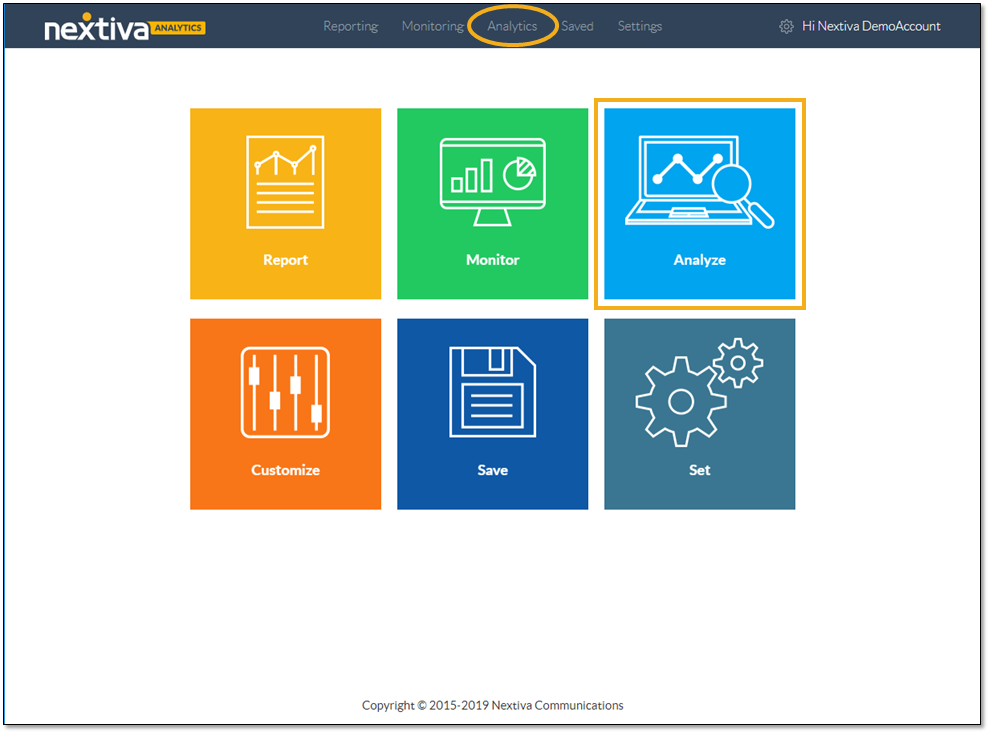
On the Nextiva Voice Analytics Home Page, click the Analyze tile or select Analytics in the top menu bar.
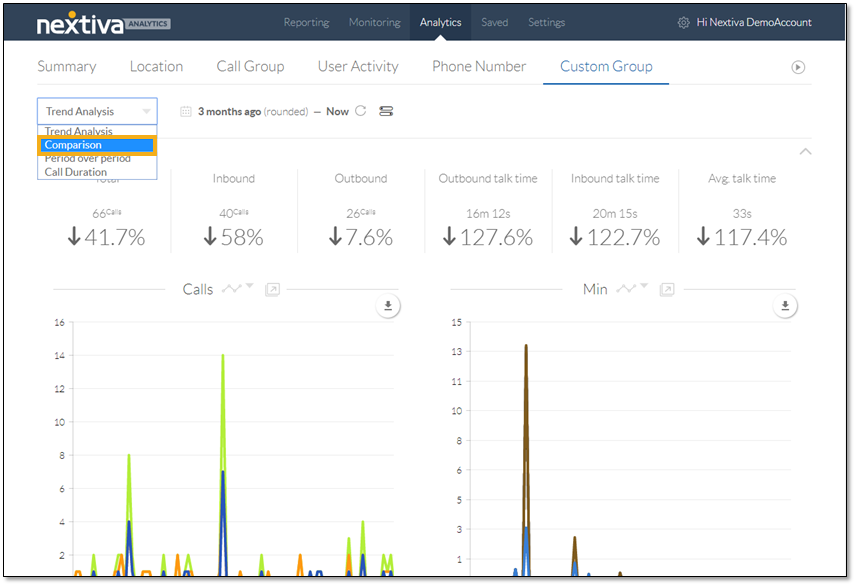
On the Custom Group tab, select Comparison from the drop-down list.
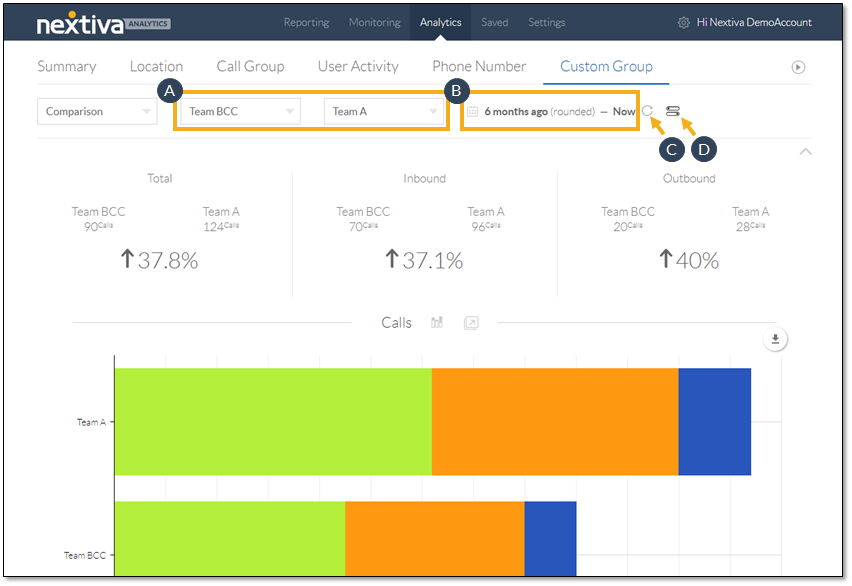
Apply comparison filters to the analytics dashboard.
- Select the high-performing group and the low-performing group from the drop-down lists.
- Specify the desired time range.
- Click to turn ON (blue) or OFF (gray) real-time data.
- Click the Slider icon to select the data to display on the dashboard.
With the desired filters in place, the customized dashboard displays the group metrics with the selected data, as well as the corresponding chart for calls.
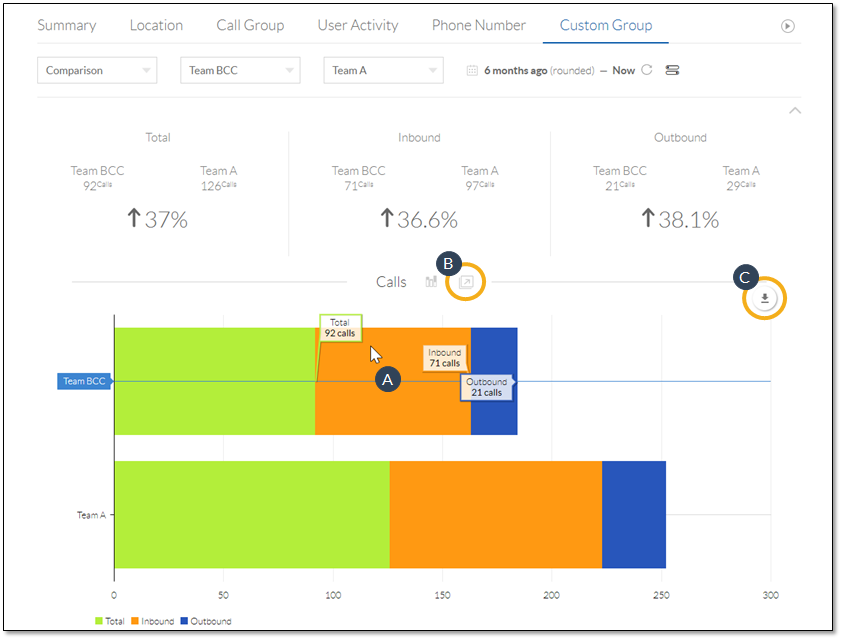
- Hover over the chart elements to view details.
- Click to pop out the chart to view it in a separate tab or window.
- Click to download the chart as a .pdf file.
Click on any metric tile to display the data in the chart that appears below the metric tiles. Click the same metric tile to restore the dashboard view.
Scroll down further to view the table of call type details for the selected groups.
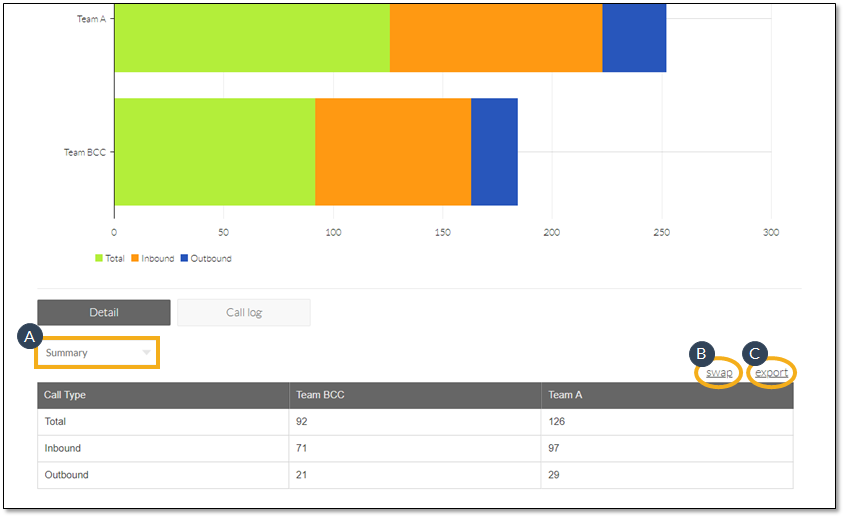
- From the drop-down list, select the desired breakdown (Summary, Daily, Weekly, Monthly, Quarterly).
- Click Swap to toggle between two table views.
- Click Export to download the data to a .csv file.
Click Call Log to view the call log for the users in the selected groups.
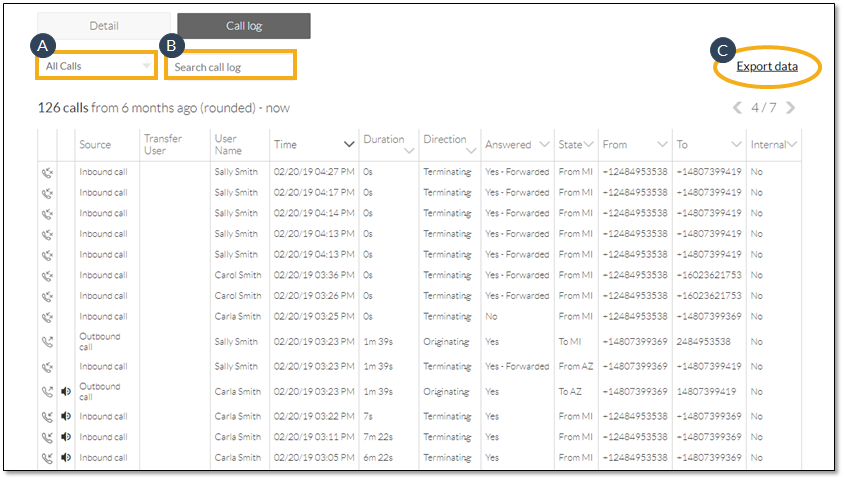
- Use the drop-down list to filter the call types (All Calls, Inbound, Outbound, Answered, Missed, and Internal).
- Enter a keyword (case sensitive) and press Enter to search the call log (e.g. user, state).
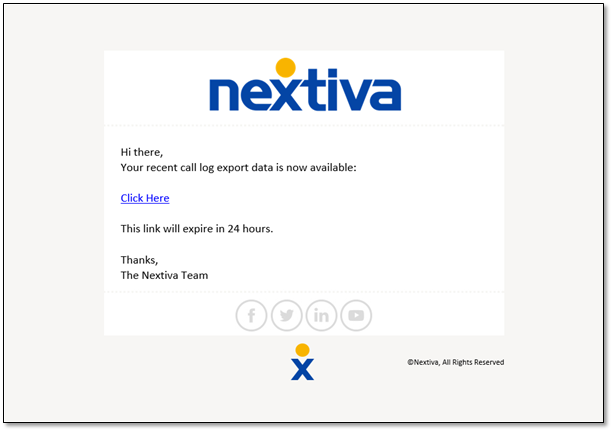
- Click Export data, then enter a valid email address (limit one) and click Send. An email with a link to the call log (.csv file), sent from analytics@nextiva.com, will arrive in the inbox of the provided email address.
Using Nextiva Voice Analytics, companies can set realistic goals to boost team performance.