How can companies identify where their advertising campaigns are most effective? Companies want to know where their marketing efforts generate the most interest in their products or services.
For example, a company launches a nationwide advertising campaign and wants to know what areas of the country express the most interest in their products so that they can increase the availability of their products in those locations.
With Nextiva Voice Analytics, companies can quickly view a heat map that displays a graphical representation of the total number of incoming calls for each state.
Visit nextiva.com, and click Client Login to log in.
If logging in from Nextiva Voice (purchased before Dec 2020), select Voice > Analytics.
If logging in from NextOS (purchased after Dec 2020), select Communication > Phone System > Voice Overview > Go to Analytics.
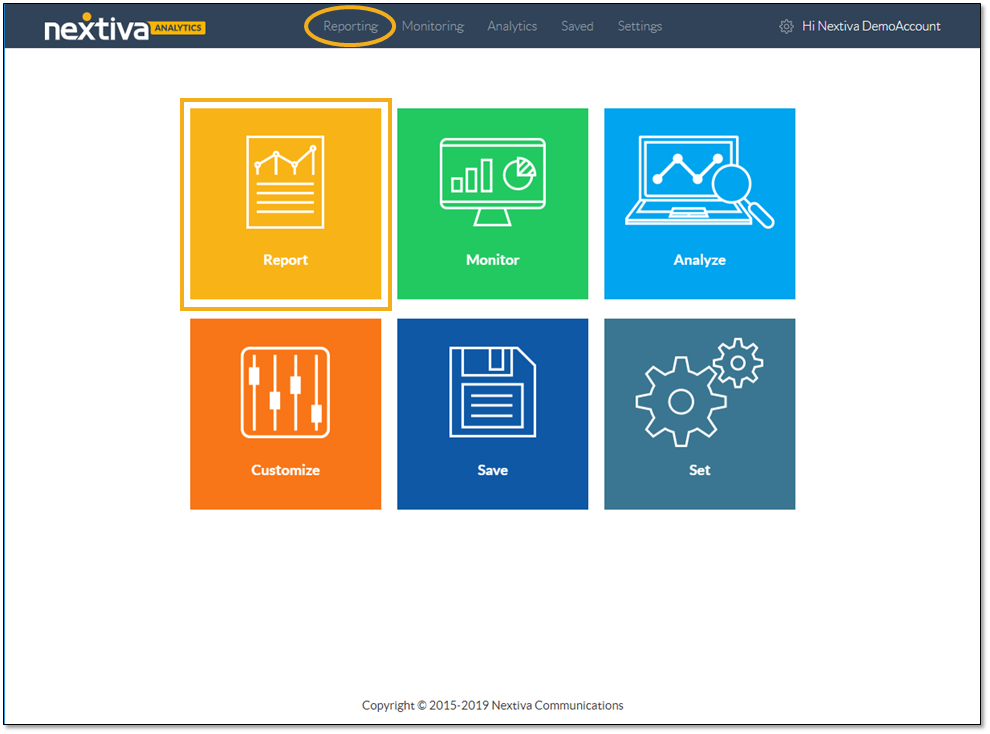
On the Nextiva Voice Analytics Home Page, click the Report tile or select Reporting in the top menu bar.
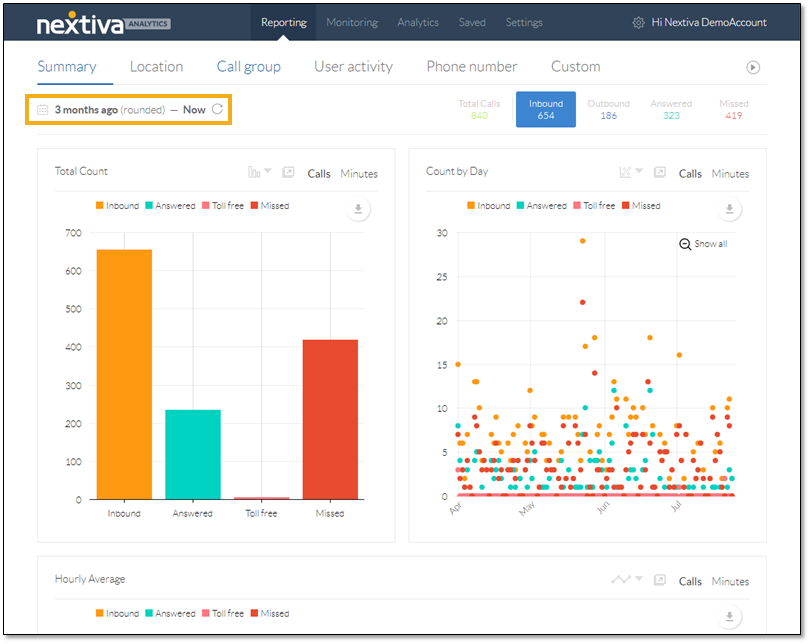
On the Summary tab, select the desired time range.
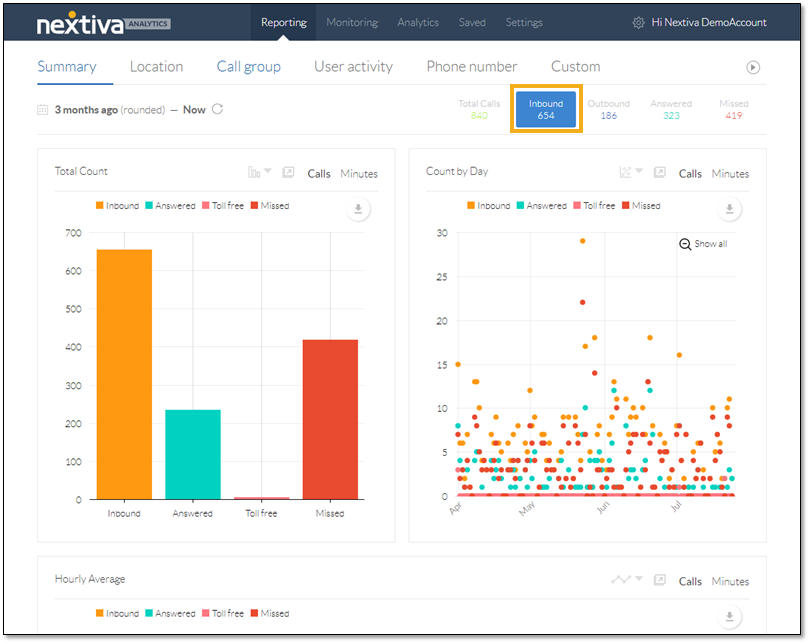
Click Inbound to narrow the scope of the data to include only incoming calls.
Scroll down to view the Counts by State heat map.
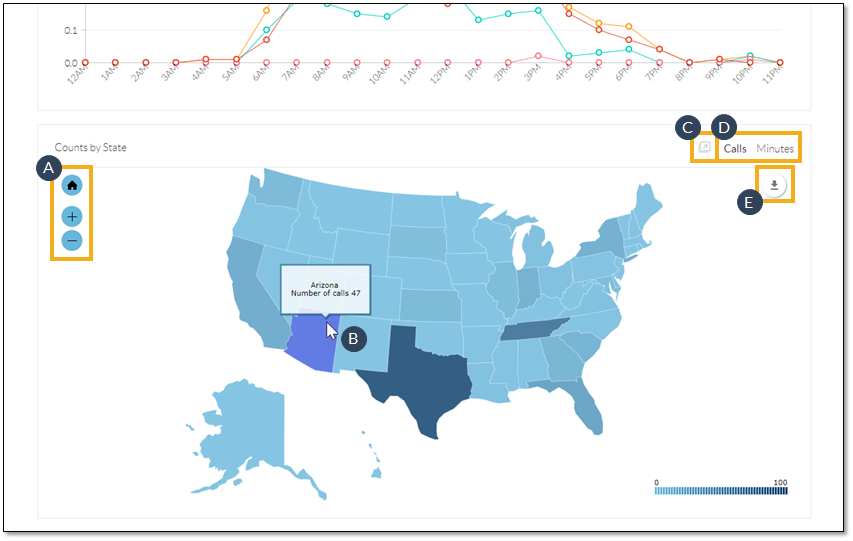
Users can customize the heat map to view the data in ways that are most useful to them. They can even download the heat map.
- Zoom in (+) and out (-), as well as click-and-drag the map to get a closer look. Click the Home button to restore the view.
- Hover over a state to view the total number of inbound calls for that state.
- Pop out the chart to view it in a separate tab or window and to access more details, as well as the call log.
- Display the data by the number of calls or by talk time.
- Download the chart to a .pdf file.
With Nextiva Voice Analytics, companies can ensure they meet customer demands following advertising campaigns.