How much potential new business did the company receive in a given time period? Companies want to know if they received any new business because it indicates growth. For example, a wireless communications service provider may want to determine how many prospects called during the last quarter.
With Nextiva Voice Analytics, companies can create a custom report to show the number of unique dials they received in a given time period. A unique dial indicates a call made from a phone number that has not been previously used to call the business, so a unique dial can represent a prospect. In addition to showing unique dials, customers can use Nextiva Voice Analytics to group those calls by call duration (i.e. call length) to obtain a more accurate look at the data. They can omit the calls with short call durations (e.g. 0 to 1 minute) from their analysis because closing a sale typically takes longer than a minute.
Visit nextiva.com, and click Client Login to log in.
If logging in from Nextiva Voice (purchased before Dec 2020), select Voice > Analytics.
If logging in from NextOS (purchased after Dec 2020), select Communication > Phone System > Voice Overview > Go to Analytics.
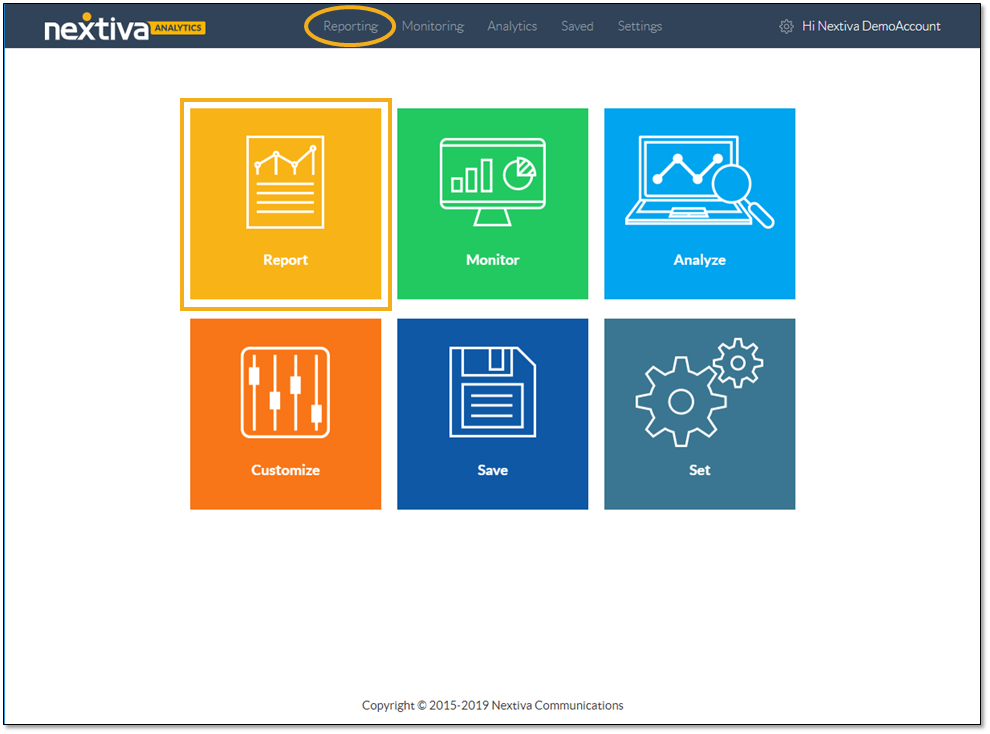
On the Nextiva Voice Analytics Home Page, click the Report tile or select Reporting in the top menu bar.
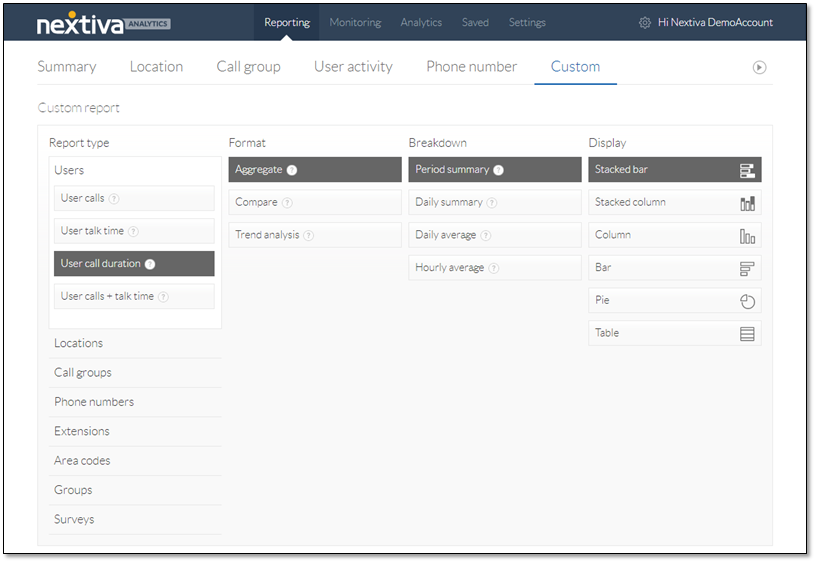
On the Custom tab, select report type Users > User call duration.
For the report format, select Aggregate.
Select the desired breakdown (Period summary, Daily summary, Daily average, or Hourly average).
Choose how to display the data (Stacked bar, Stacked column, Column, Bar, Pie, or Table).
NOTE: The Daily Summary breakdown only displays in the Stacked column, Stacked bar, and Table views. The Hourly Average breakdown only displays in the Line and Stacked column views.
Scroll down to view the sample report and apply filters.
NOTE: The chart shows sample data. Run the report to view the actual data.
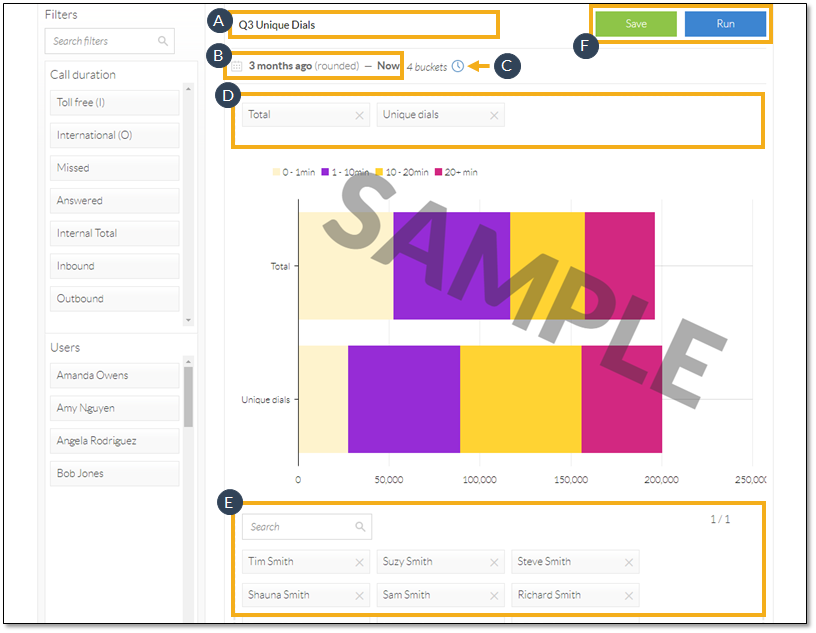
- Enter a title for the report.
- Select the desired time range.
- Define the duration buckets by specifying the call length ranges for each bucket. Click the Plus (+) or Minus (-) icons to add or remove buckets as needed. Click Update to save the changes.
- Choose the call types to display in the report. Add call types from the Call duration bank in the left panel or remove them by clicking the X corresponding to the call type to be removed.
- Select the users to include in the report. Add users from the Users bank in the left panel or remove them by clicking the X corresponding to the user to be removed.
- Click Save to save and run the custom report. Click Run to run the custom report without saving it.
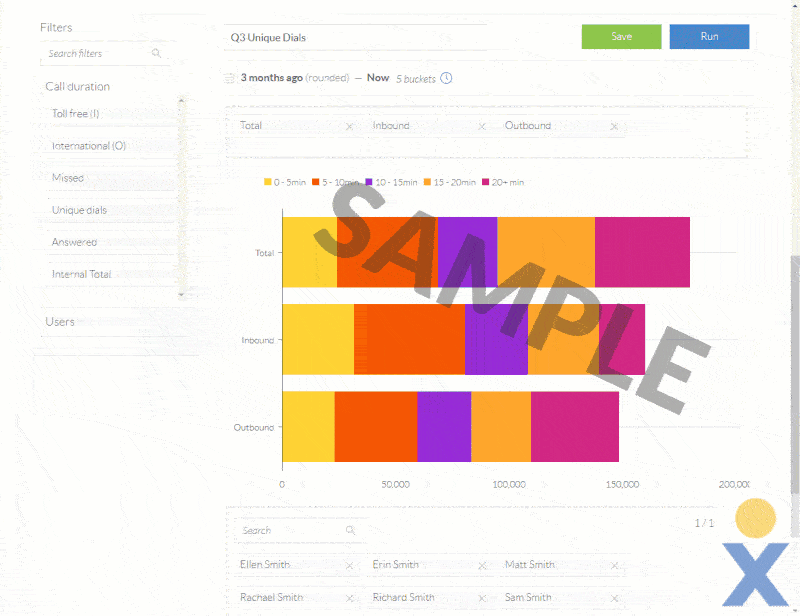
After running the report, users can further refine the data, view details, and download the chart.
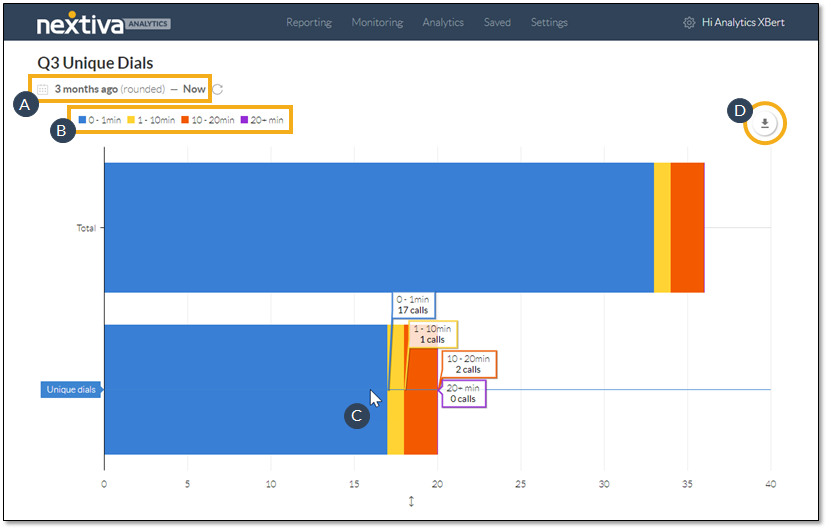
- Change the time range.
- Click to hide or restore duration buckets.
- Hover over the chart elements to view more details.
- Click to download the chart as a PDF file.
By using Nextiva Voice Analytics to obtain information on unique dials and call duration, companies can easily identify business growth.