How can companies evaluate the effectiveness of their advertising campaigns? Companies want to know whether or not their advertising efforts are generating increased interest in their products or services.
For example, a company launches two new advertisements, each with a dedicated phone number, and wants to know how much interest they are generating. They also want to know which campaign is more effective.
TIP: Track call data on advertising campaigns more efficiently by using one phone number for each campaign. To add phone numbers to an account, contact a Nextiva Account representative.
With Nextiva Voice Analytics, companies can compare the total number of calls received for each advertising campaign.
Visit nextiva.com, and click Client Login to log in.
If logging in from Nextiva Voice (purchased before Dec 2020), select Voice > Analytics.
If logging in from NextOS (purchased after Dec 2020), select Communication > Phone System > Voice Overview > Go to Analytics.
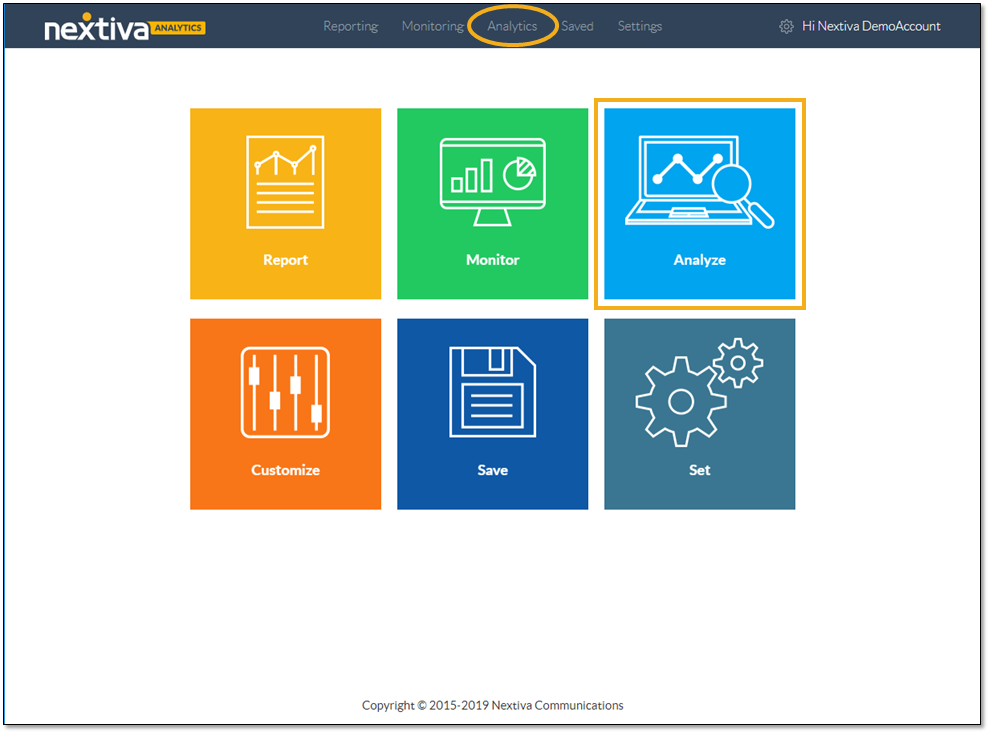
On the Nextiva Voice Analytics Home Page, click the Analyze tile or select Analytics in the top menu bar.
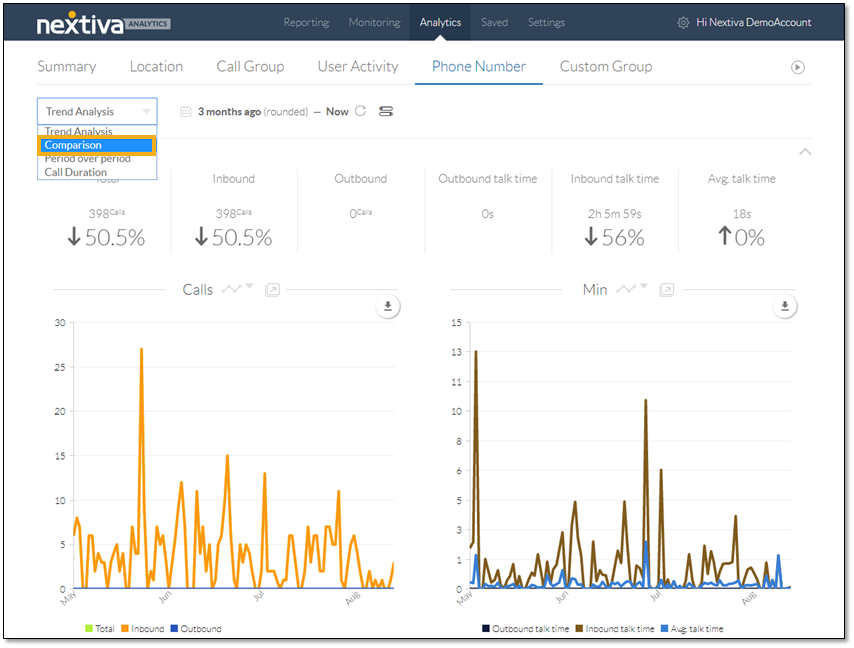
On the Phone Number tab, select Comparison from the drop-down list.
Apply comparison filters to the analytics dashboard.
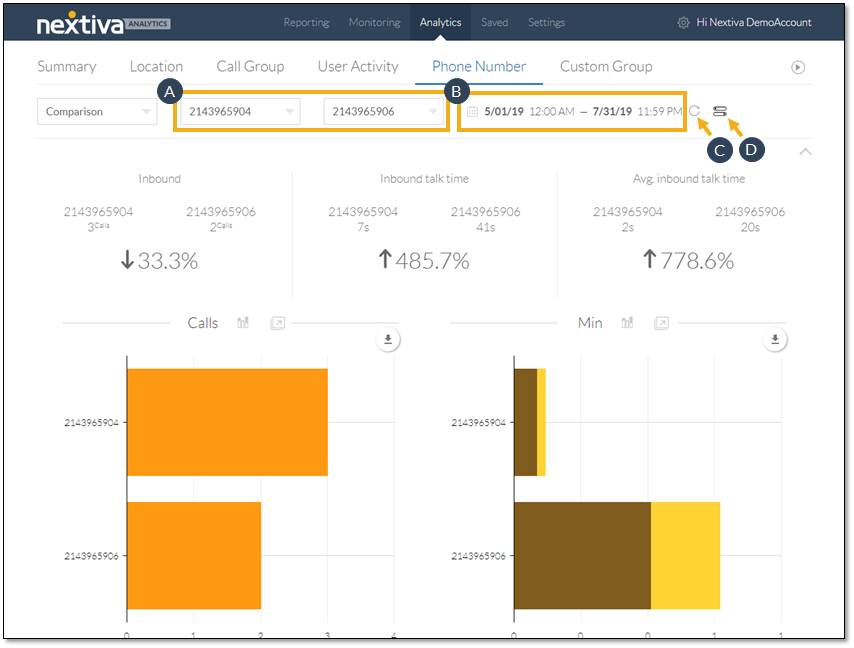
- Select the phone numbers corresponding to the advertising campaigns from the drop-down lists.
- Specify the desired time range.
- Click to turn real-time data ON (blue) or OFF (gray).
- Click the Slider icon to select the call metrics to display on the dashboard.
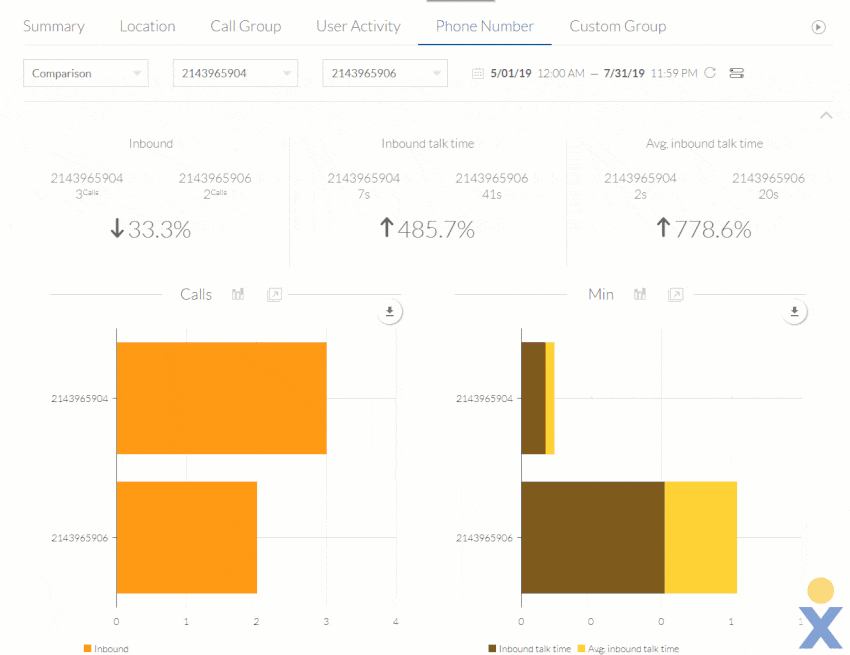
With the desired filters in place, the customized dashboard displays the metrics by phone number, as well as corresponding charts for calls and minutes.
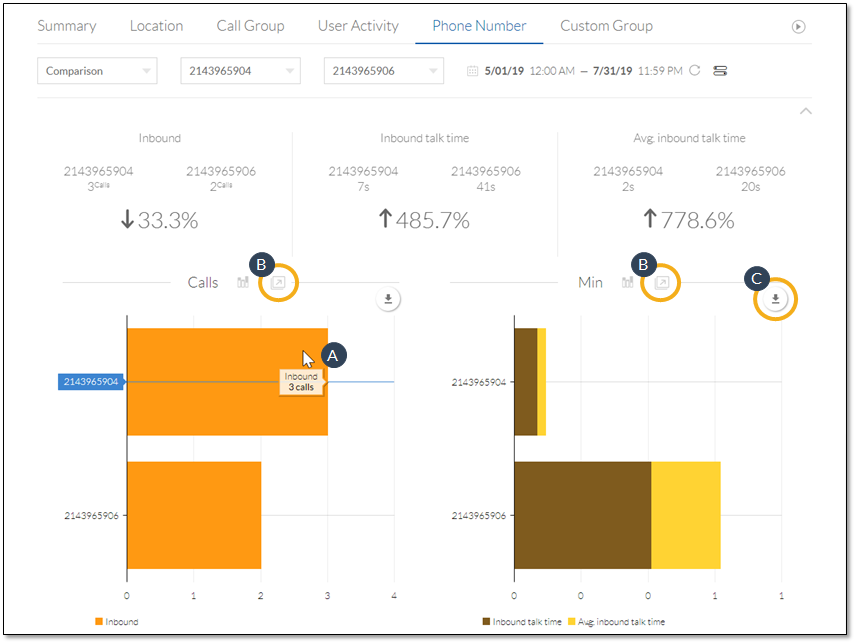
- Hover over the chart elements to view details.
- Click to pop out the chart to view it in a separate tab or window.
- Click to download the chart as a .pdf file.
Click any metric tile to open the data in a chart below the metric tiles. Click the same metric tile to restore the dashboard view.
Scroll down further to view the table of call type details for the selected phone numbers.
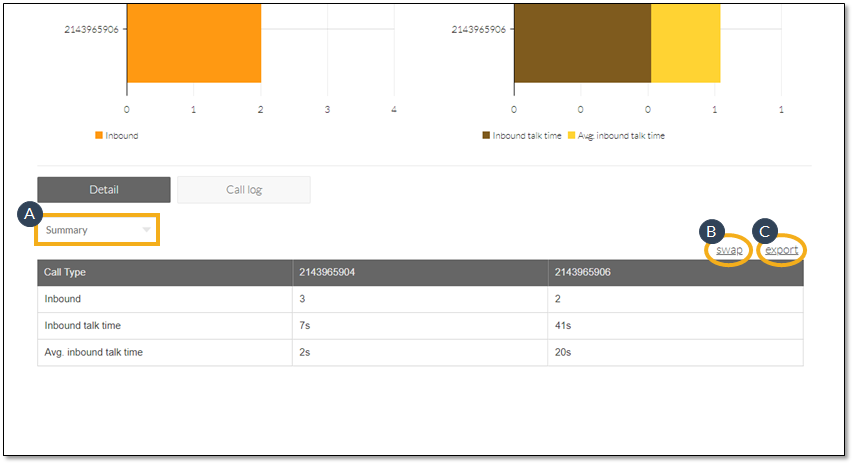
- From the drop-down list, select the desired breakdown (Summary, Daily, Weekly, Monthly, Quarterly).
- Click Swap to toggle between two table views.
- Click Export to download the data as a .csv file.
Click Call Log to view the call log for the selected phone numbers.
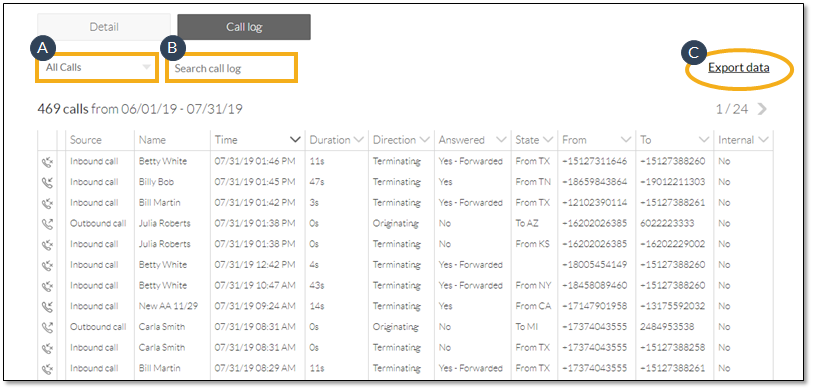
- Use the drop-down list to filter the call types (All Calls, Inbound, Outbound, Answered, Missed, and Internal).
- Enter a keyword (case sensitive) and press Enter to search the call log (e.g. user, state).
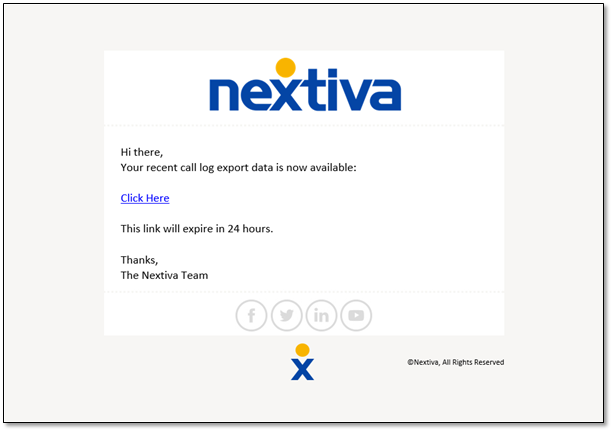
- Click Export data, then enter a valid email address (limit one) and click Send. An email with a link to the call log (.csv file), sent from analytics@nextiva.com, will arrive in the inbox of the provided email address.