While viewing reports, Administrators can drill down in a column or stack chart to see the data of a single point, grouped by a dimension. This allows them to analyze the data in one chart from different angles, without having to create multiple reports.
- In the Report Builder view, click the Ellipses icon corresponding to the desired report, and select View to review the report.
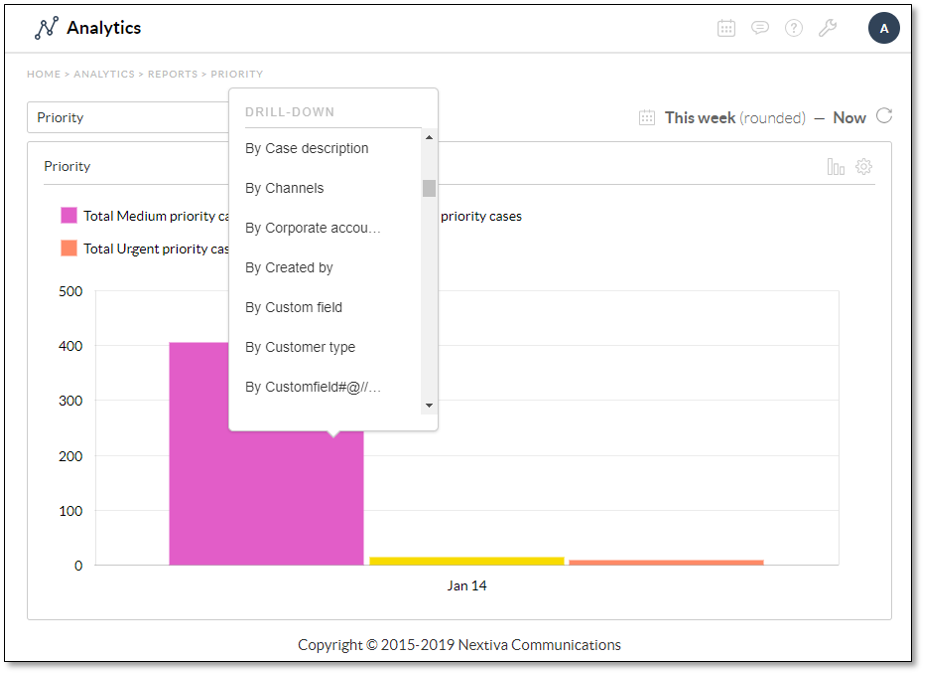
- Click a single point in the column or stack chart (change the chart type, if needed) to open the Drill-Down menu, and select a dimension by which to group the data.
Some dimensions include:
- By Account
- By Channels
- By Department
- By Priority
- By Status
- By User
The menu will also list the custom fields (of Type = text).
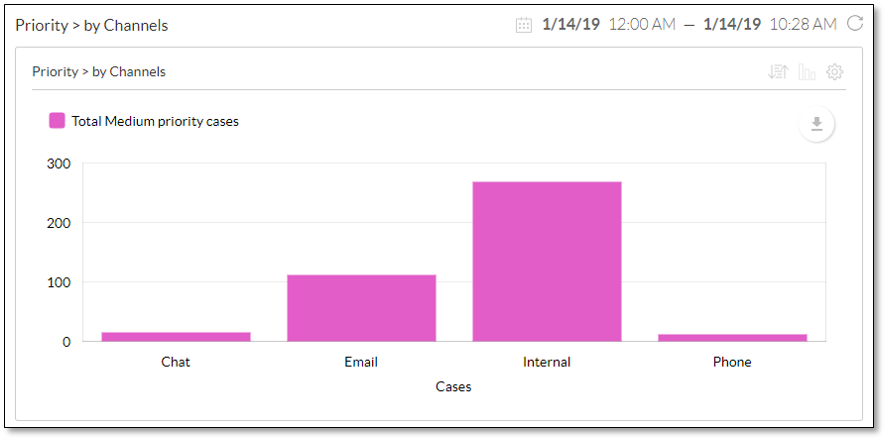
A new page opens to display the data of a single point, grouped by a dimension.
For example, selecting By Channels from the Drill-Down menu for Priority will display the Total Medium Priority Cases data, grouped by Channel.
Drill down further by selecting another dimension from the Drill-Down menu until no more data is returned, at which point the error message “No further drill down levels available” will appear.
Click the Down Arrow icon near the top-right corner of the chart to save the drilled-down chart as a .pdf, .png, or .jpg file. The drilled-down reports can also be exported to a .csv file. For information on exporting reports, click here.
NOTE: Any filter applied to the drill-down page will only narrow the data. More data cannot be added by updating the filters. For instance, if you are on the top level and your time range is “This week (rounded) — now,” and you drill down to the next level, you will not be able to change the time range to include more days, e.g. “Two weeks ago (rounded) — now.” You can only shorten the date range, e.g. “Today.”
