When should companies run advertisements? Companies want to run ads when they can reach the most people in order to generate the most interest in their products and services.
For example, a company has been running a radio advertisement every day for several months and now wants to put it on a schedule to cut costs. They want to make sure that they run their ad on a day that would reach the most people.
TIP: Track call data on advertising campaigns more efficiently by using one phone number for each campaign. To add phone numbers to an account, contact a Nextiva Account representative.
With Nextiva Voice Analytics, companies can identify trends in the number of calls received per day for an advertising campaign.
Visit nextiva.com, and click Client Login to log in.
If logging in from Nextiva Voice (purchased before Dec 2020), select Voice > Analytics.
If logging in from NextOS (purchased after Dec 2020), select Communication > Phone System > Voice Overview > Go to Analytics.
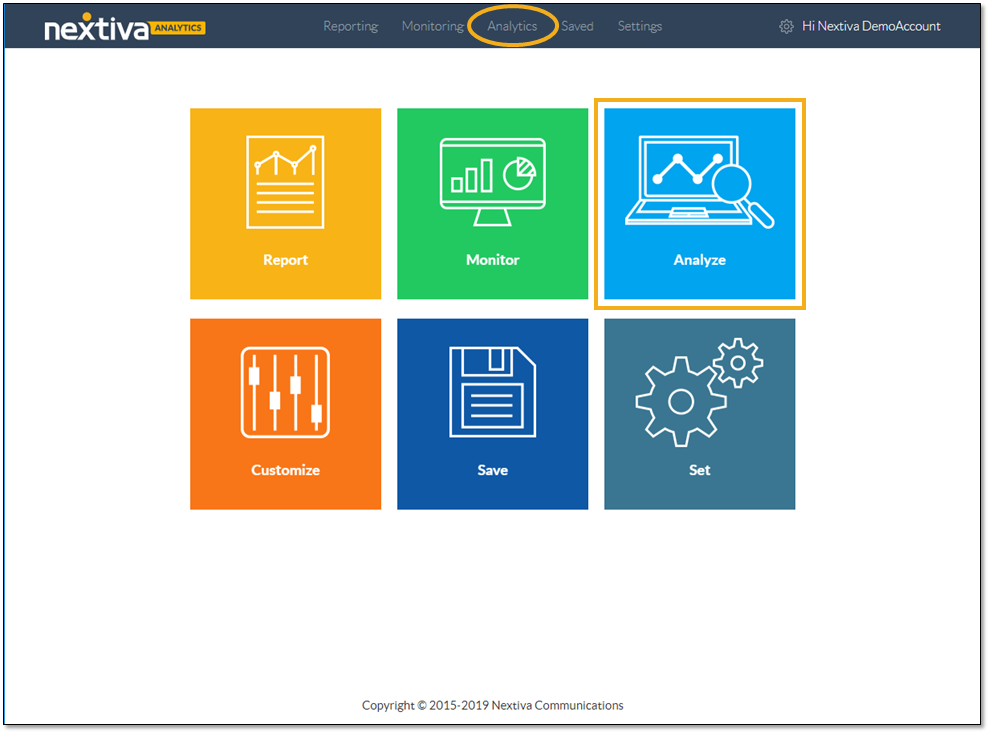
On the Nextiva Voice Analytics Home Page, click the Analyze tile or select Analytics in the top menu bar.
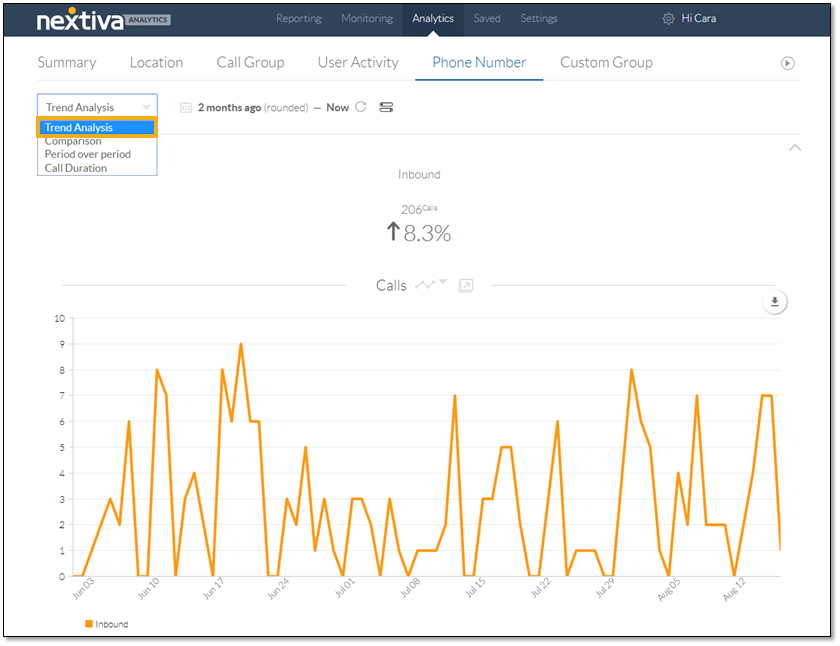
On the Phone Number tab, select Trend Analysis from the drop-down list.
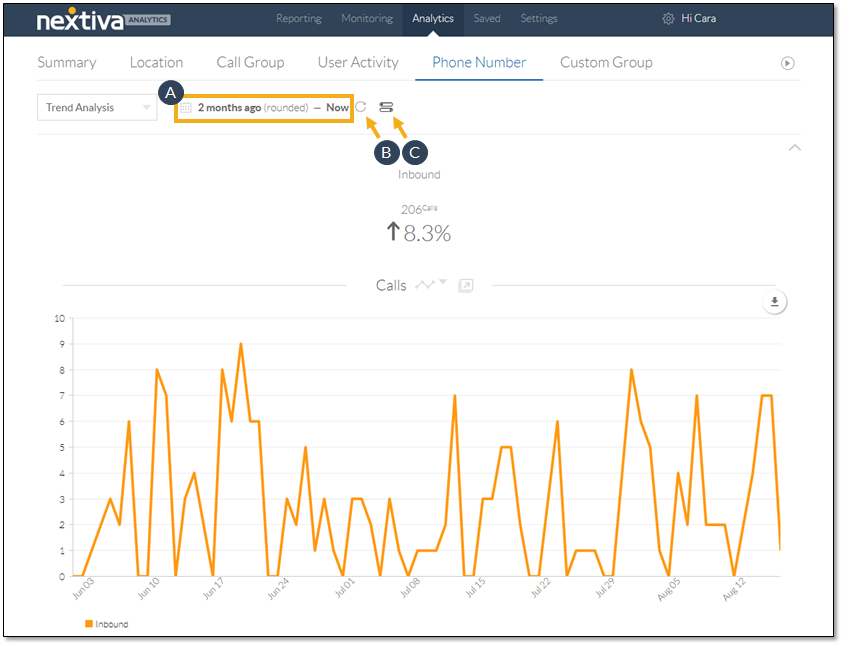
Apply filters to the trend analysis dashboard.
- Specify the desired time range.
- Click to turn real-time data ON (blue) or OFF (gray).
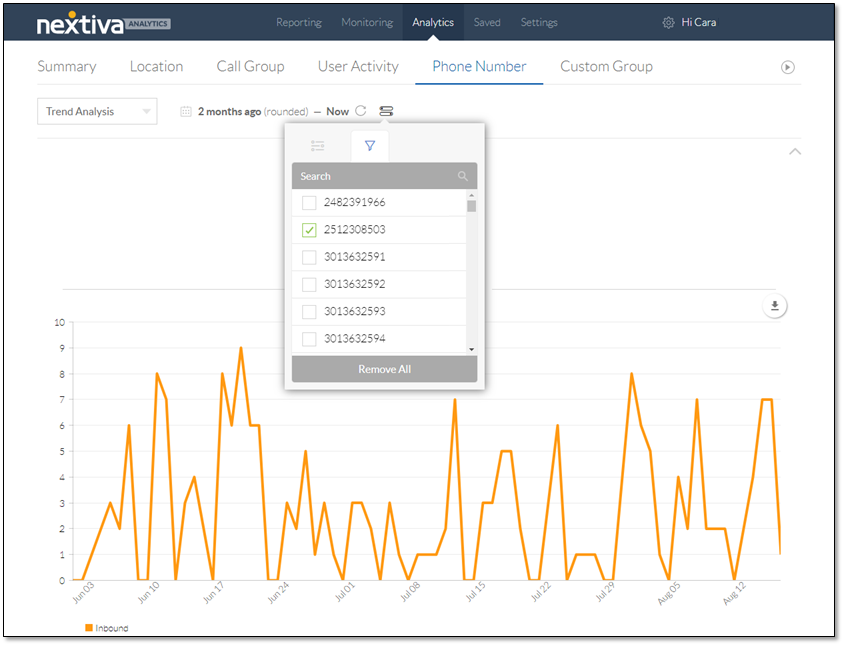
- Click the Slider icon to open the configurator.
The configurator includes two tabs for customizing the trend analysis dashboard: Metrics and Phone Numbers.
On the Metrics tab, select Inbound to display the total number of inbound calls during the specified time range.
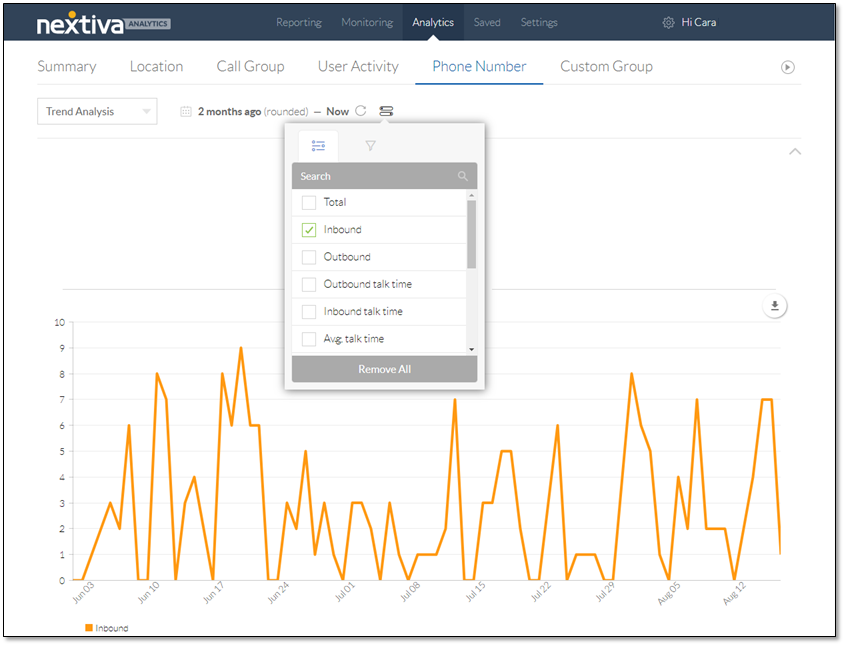
On the Phone Numbers tab of the configurator, select the phone number corresponding to the advertisement.
With the desired filters in place, the customized dashboard displays the Inbound metrics and a corresponding Calls chart. Users can customize the chart to view the data in ways that are most useful to them. They can even download the chart.
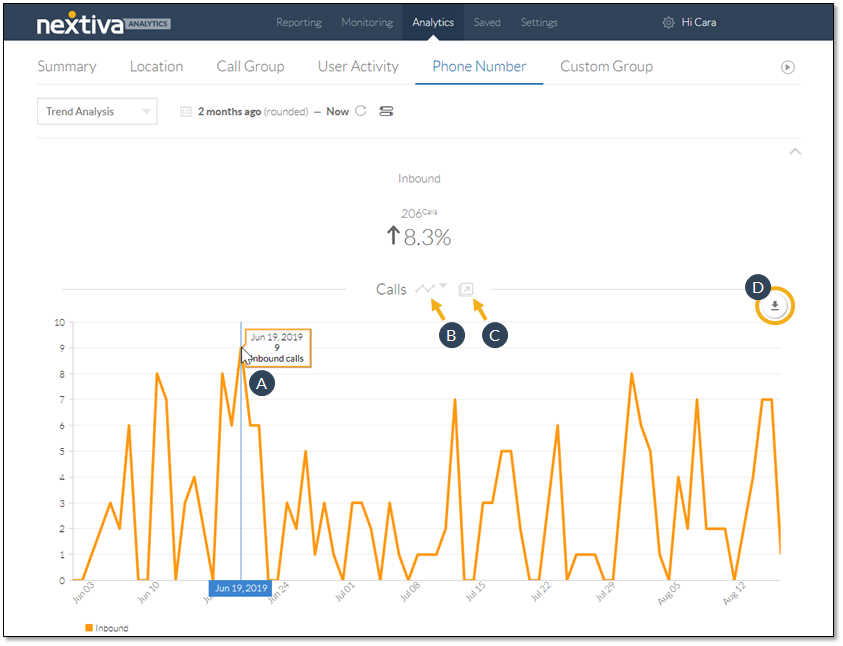
- Hover over the chart elements to view details.
- Click to change the chart type (Line or Smooth Line).
- Click to pop out the chart to view it in a separate tab or window.
- Click to download the chart as a .pdf file.
This chart shows the majority of spikes in the number of inbound calls corresponds to Wednesday. With this data, the company would want to schedule the advertisement to run on that day.
For a different view of the same data, scroll below the Calls chart to view the table of call type details.
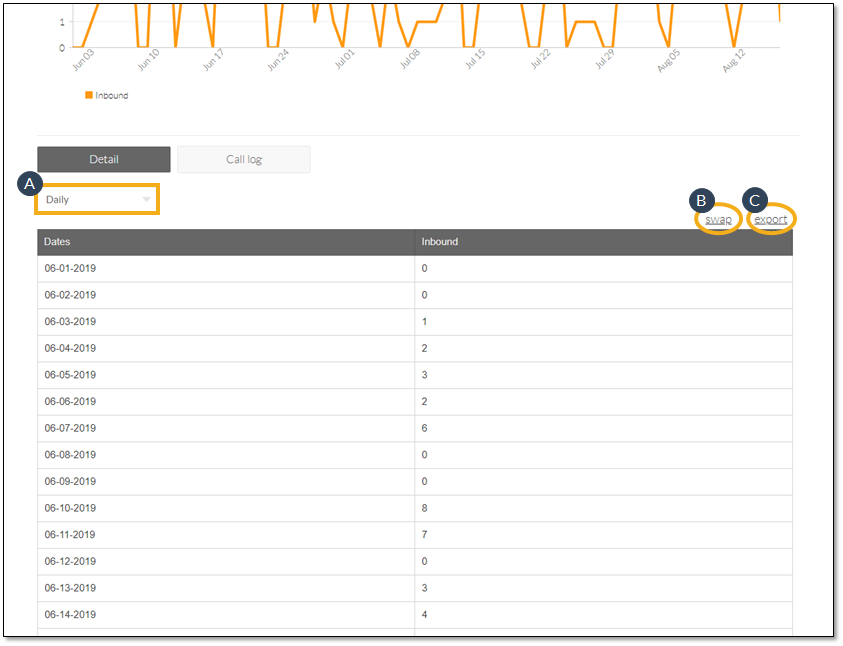
- From the drop-down list, select the desired breakdown (Summary, Daily, Weekly, Monthly, Quarterly).
- Click Swap to toggle between two table views.
- Click Export to download the data as a .csv file.
Companies invest in advertisements to generate more business. When they can strategically run ads, they optimize their return on investment.