How can a company determine the best hours of operation? When choosing business hours, companies want to craft their schedules around the busiest times to capture the most calls.
Many factors can play into when a company might be busier at certain times and not others. For example, a bakery would likely see more traffic in the morning hours than in the evening hours. A costume store would likely see a surge in business during the months and weeks leading up to Halloween. If a company caters to customers in a different country, then it would be most effective to choose operating hours to match those of the country it is serving.
A great way to determine the peak hours of business is to look at call activity data. Nextiva Voice Analytics generates reports with easy-to-view charts that capture call activity data on any given period of time. Once companies identify the peak hours of the day, days of the week, or even months of the year, they can determine the most optimal times for their hours of operation.
During what hours of the day has the company received the most calls? View the hourly average of incoming calls for a given period in Nextiva Voice Analytics.
Visit nextiva.com, and click Client Login to log in.
If logging in from Nextiva Voice (purchased before Dec 2020), select Voice > Analytics.
If logging in from NextOS (purchased after Dec 2020), select Communication > Phone System > Voice Overview > Go to Analytics.
On the Nextiva Voice Analytics Home Page, click the Report tile or select Reporting in the top menu bar.
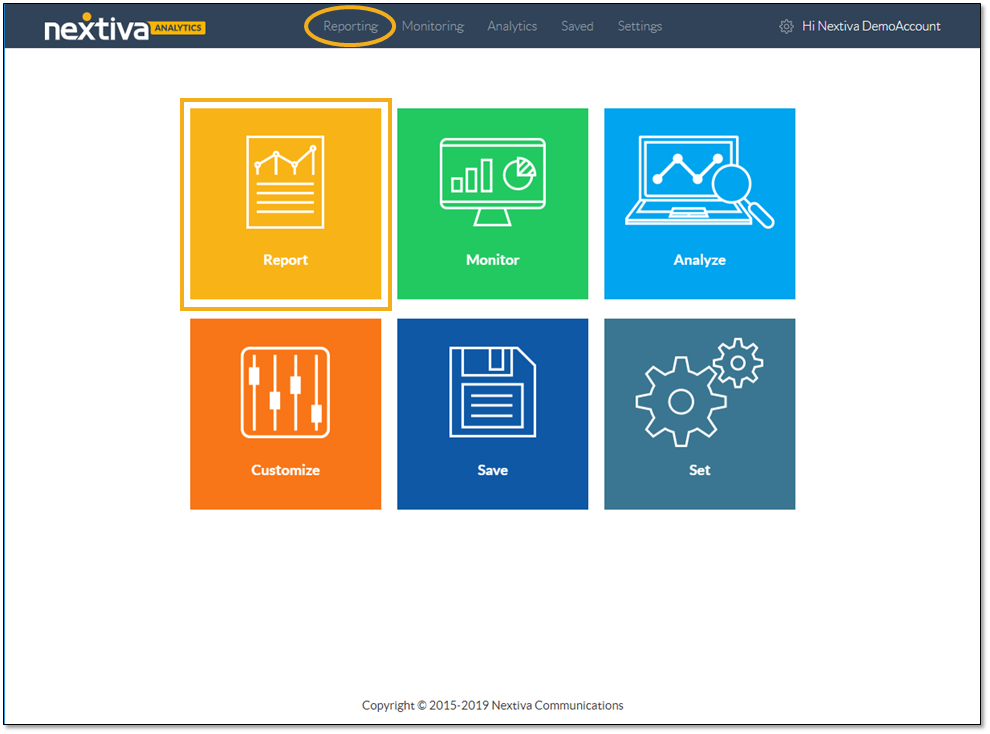
Nextiva Voice Analytics Home Page
- On the Summary tab, select the desired time range.
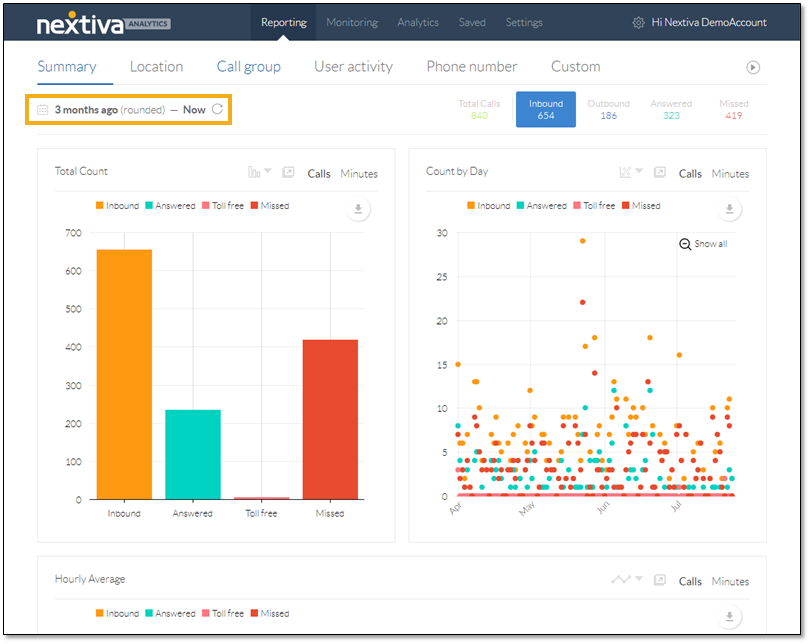
Time Range Selector on the Summary Tab
- Click Inbound to narrow the scope of the data to include only incoming calls.
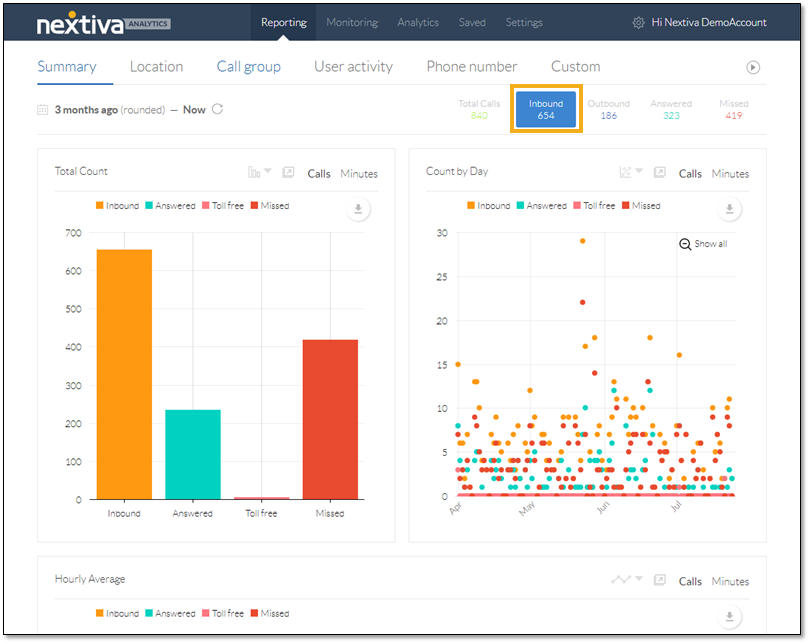
Inbound Call Data on the Summary Tab
- Scroll down to view the Hourly Average chart.
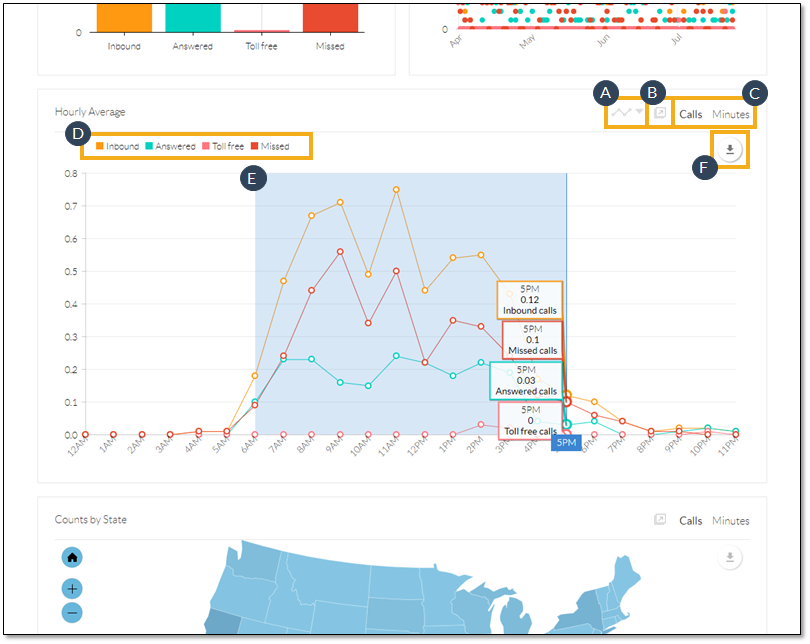
Hourly Average Chart
Users can customize the chart to view the data in ways that are most useful to them. They can even download the chart.
- Change the chart type (Line, Column, and Stacked Column).
- Pop out the chart to view it in a separate tab or window and to access more details, as well as the call log.
- Display the data by the number of calls or by talk time.
- Filter the data to display or hide Inbound, Answered, Toll-Free, and Missed calls.
- Click-and-drag across the chart to highlight a specific portion of the chart for a closer look at the data. Click Show All to restore the chart to the original view.
- Download the chart to a .pdf file.
Based on the data in the Hourly Average chart above, the company should set their hours of operation between the hours of 5:00 am and 8:00 pm.