A successful business requires building a sales team that possesses the skills and knowledge to perform effectively. How can a new company maximize the productivity and efficiency of their sales team to earn as many customers as possible?
Suppose a company has assembled a team of sales agents to create leads and close sales. In order to ensure the success of the sales team, the company must identify the key performance indicators (KPI’s) by which to measure employee performance, determine objectives, and set expectations.
For sales teams, important KPIs include the number of inbound and outbound calls and the number of unique dials. The more calls the sales agents make to prospects, the more they will increase their chances of generating leads and converting them to sales. Inbound calls represent prospects who want to learn more about the company’s products and services. The more inbound calls the sales agents take, the more likely they can turn prospects to clients. Companies want to see higher numbers for outbound and inbound calls.
Similarly, they want to see high numbers for unique dials. A unique dial indicates a call made from a phone number that has not been previously used to call the business. It also indicates a call made to a phone number that has not been previously dialed from the business. Thus, a unique dial can represent a new prospect.
With Nextiva Voice Analytics, companies can track these KPI’s to drive employee performance and sales. Track the sales KPI’s with the monitoring tools featured in Nextiva Voice Analytics.
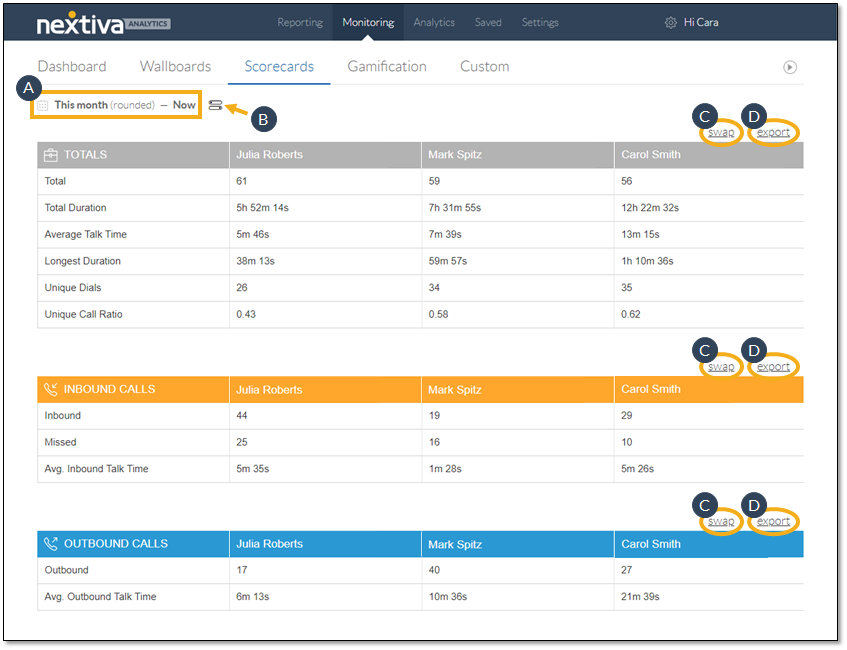
Customize the scorecard to view call data for inbound and outbound calls and unique dials for each sales agent.
Visit nextiva.com, and click Client Login to log in.
If logging in from Nextiva Voice (purchased before Dec 2020), select Voice > Analytics.
If logging in from NextOS (purchased after Dec 2020), select Communication > Phone System > Voice Overview > Go to Analytics.
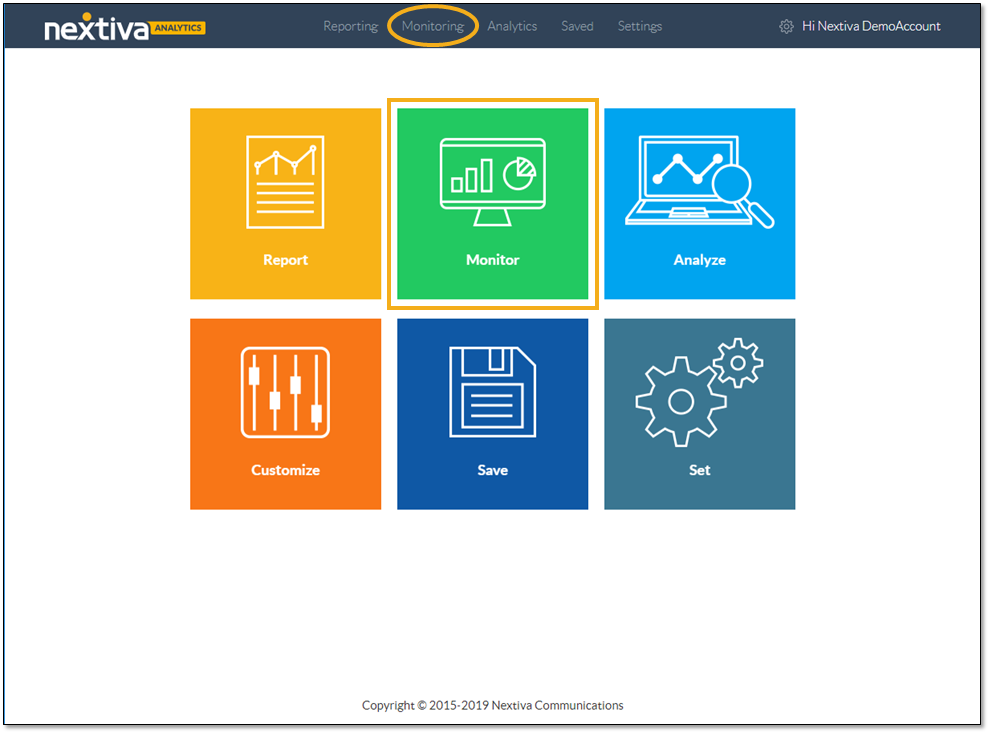
On the Nextiva Voice Analytics Home Page, click the Monitor tile or select Monitoring in the top menu bar.
On the Scorecards tab, customize the scorecard:
- Select the desired time range.
- Click the Slider icon to open the configurator.
- Click Swap to toggle between two table views.
- Click Export to download the data as a .csv file.
The configurator includes three tabs for customizing the scorecard: Scorecard Type, Filter, and Time Breakdown.
The Scorecard Type tab presents the options for the type of information to display on the scorecard: Users, Locations, Call Groups, and Custom Groups, if any have been created. Select Users to view the call data information for the sales agents.
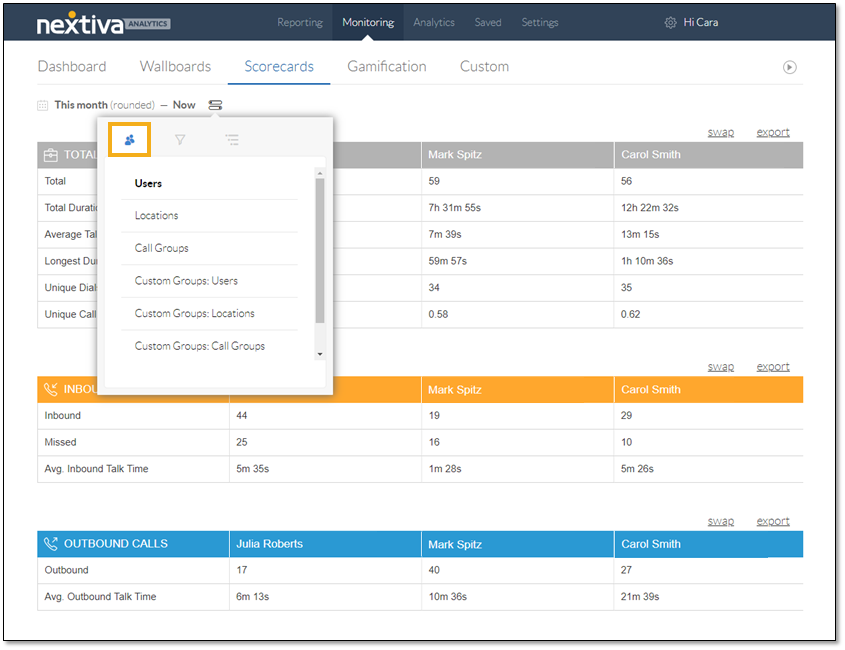
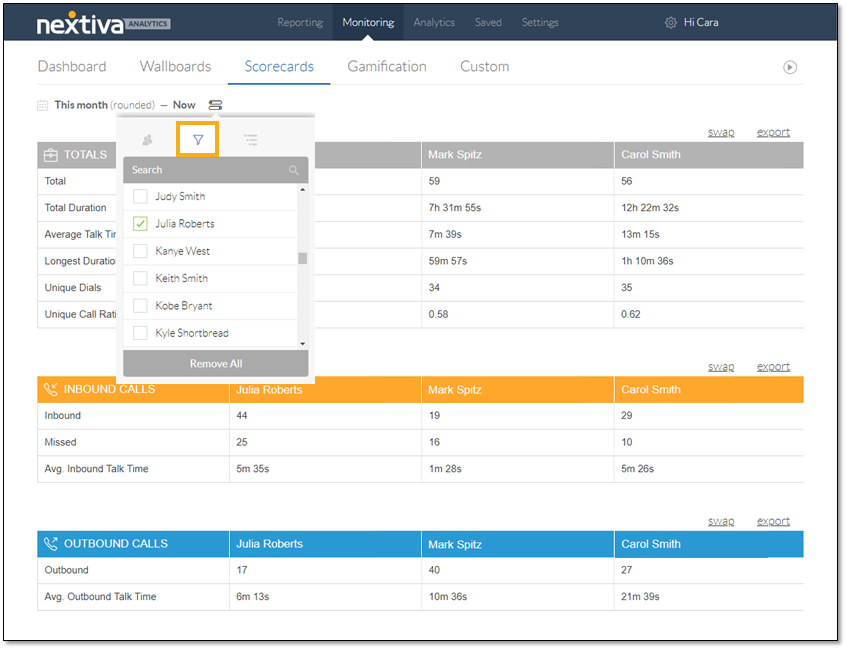
Refine the data to display on the scorecard, based on the scorecard type. For example, after selecting Users on the Scorecard Type tab, select specific Users on the Filters tab.
On the Time Breakdown tab, click to specify the breakdown of the data by time: Summary, Daily, Weekly, Monthly, or Quarterly.
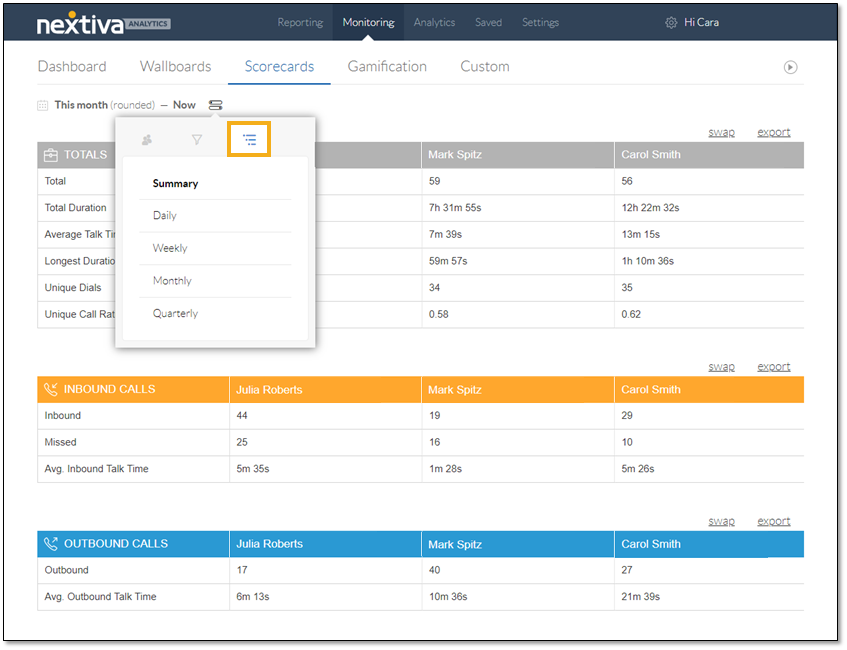
The analytics scorecard displays call data for each of the sales agents. Companies can use this data to determine goals and set expectations for their sales team. For example, companies can find the average number of unique dials and set that value as the target goal for their sales team. In this example, the analytics scorecard shows 32 as the average number of unique dials for the month. The company can hold sales agents accountable for 32 unique dials per month.
TIP: Some companies may want to base the target goal on the unique call ratio, which is the ratio of the number of unique dials to the total number of calls. The higher the unique call ratio, the more potential for new business.
Companies can also use the inbound calls KPI to determine realistic goals and set expectations. While sales agents cannot control the number of calls that come in, they can control the number of calls they miss. For example, companies can keep the number of missed calls to a minimum by setting a cap based on the median number of missed calls presented on the scorecard. Based on the data for missed inbound calls in the sample analytics scorecard, the company would set a cap at 16 missed calls, and any agent who exceeds that number would be eligible for coaching.
Perhaps the most important call metric for sales is outbound calls. The more outbound calls a sales agent makes, the more prospects they can reach. The bigger the pool of prospects, the more sales they can potentially close. Companies can use outbound call data to set a target for sales agents. For example, a business can challenge their sales team to reach a target based on the average number of outbound calls made in a previous month. In the sample analytics scorecard, the average is 28 calls. The company can set the target at 30 calls.
When companies set goals for their employees and hold them accountable, employees feel engaged and motivated to perform better, which contributes to the success of the company.