

| Customer Service Metric Definition Customer service metrics are key performance indicators (KPIs) that help measure the efficiency of your support team, such as how long your customers are on hold, how long it takes agents to resolve an issue, your peak call hours, and much more. |
The more value you create for your customers, the less you generally have to worry about losing their business. You can measure your effectiveness with several customer service metrics or KPIs that illustrate different parts of the customer experience.
The right customer experience tools help track these key metrics and improve service with a holistic view of the customer journey. At the same time, if you don’t meet customer expectations, they just might stray from your stable — and quickly.
At least one-third of consumers said they would consider switching companies after just one instance of bad customer service. Those customers didn’t just take their business elsewhere but were also likely to tell their peers or the general public about their poor customer service interactions.
We compiled these 17 best benchmarks to help nourish your customer relationships and avoid customer service pitfalls.
- Average Wait Time
- Rate of Answered Calls
- First Contact Resolution Rate
- Call Service-Level Agreement
- Average Handle Time
- Average Interactions Per Ticket
- First Response Time
- Average Response Time
- Average Resolution Time
- Issue Resolution Rate
- Self-Service Usage
- Backlog
- Customer Satisfaction Score
- Net Promoter Score
- Customer Effort Score
- Customer Churn
- Repurchase Rate
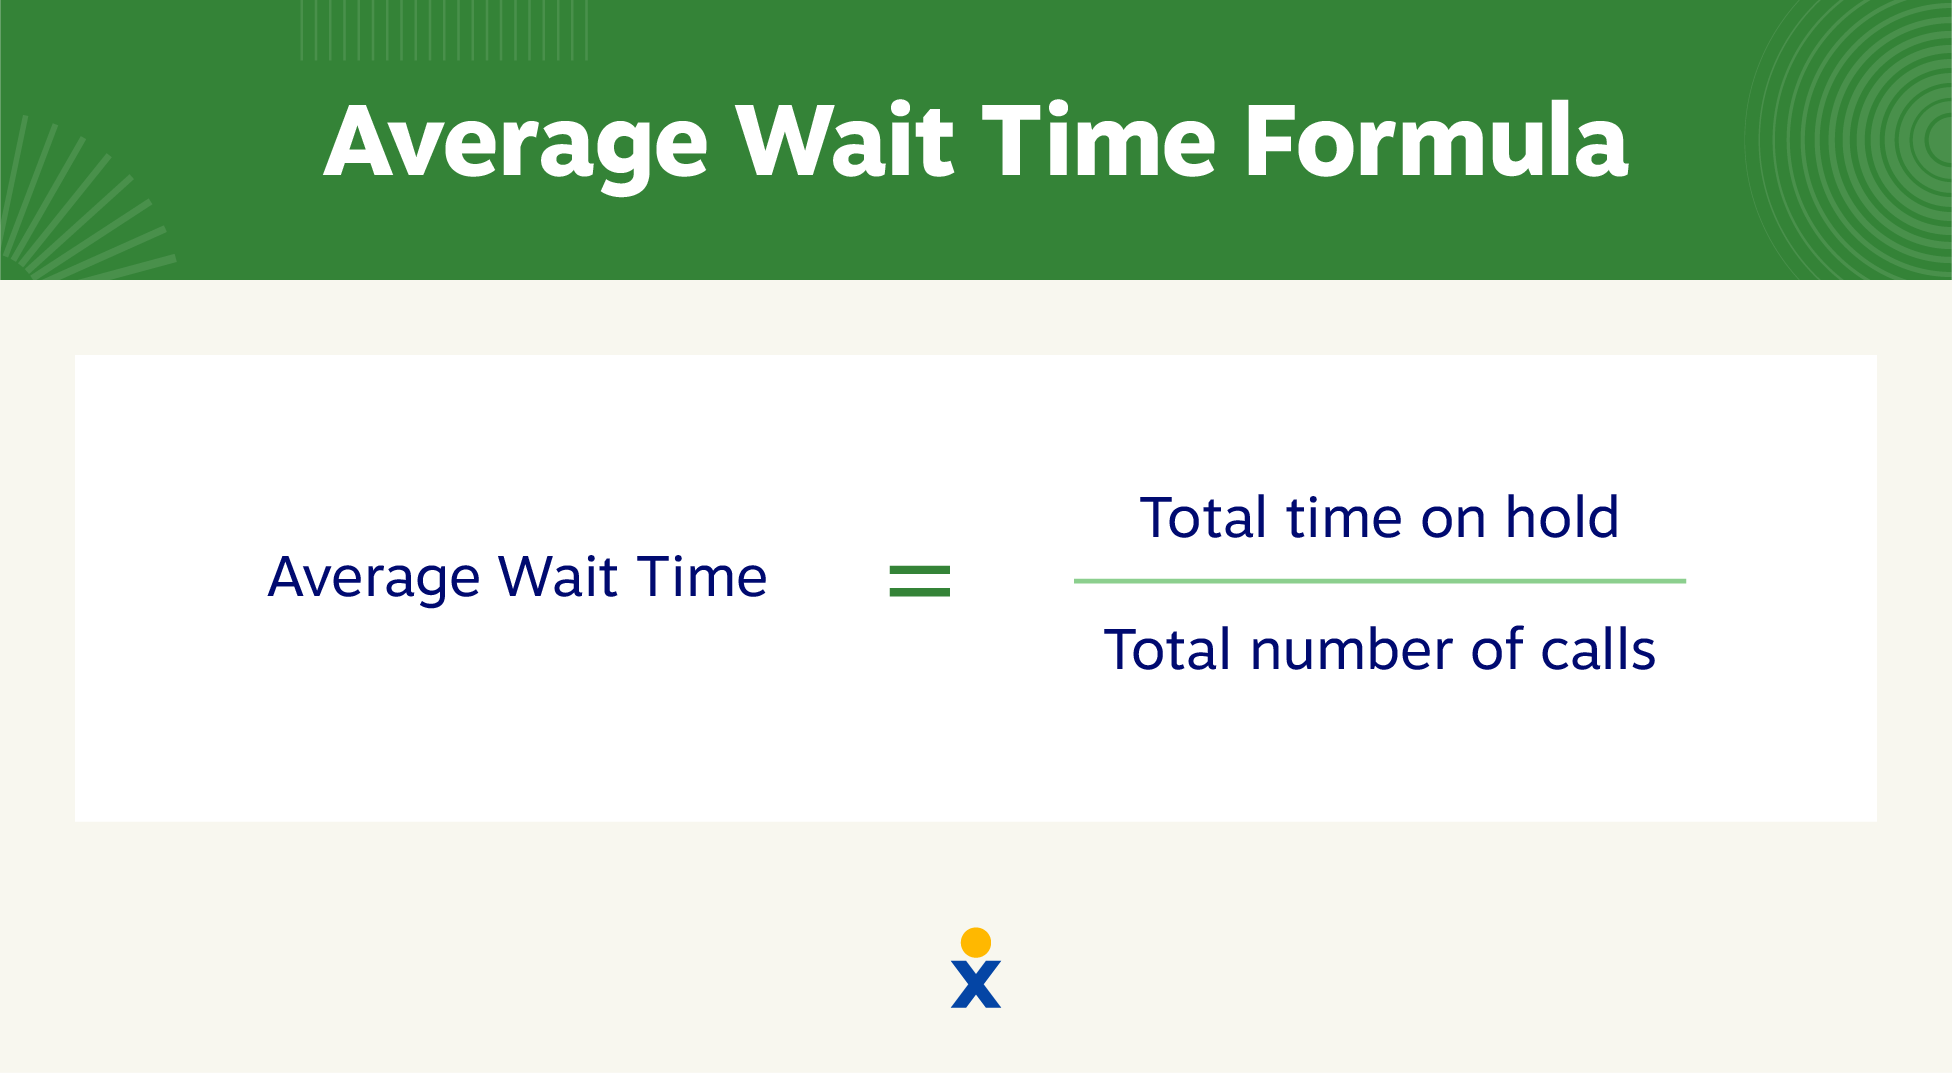
1. Average Wait Time
Average wait time is the average time customers spend before connecting with a support agent.
No one likes waiting on hold, especially your customers with important questions about your products. When customers wait, they’re 16 times more likely to feel impatient than excited or any other non-negative emotion besides neutrality.
| 💡How to improve it: Use VoIP phone service to gather and display vital customer information before answering their call, so your agents spend less time digging. |
2. Rate of Answered Calls
The one frustration that enrages customers most is waiting through long, scripted prompts before speaking with an agent. A high percentage of missed calls means you have lots of customers with negative experiences who gave up before they got through to someone.
Remember: Just one bad experience can send at least a third of your customers packing.
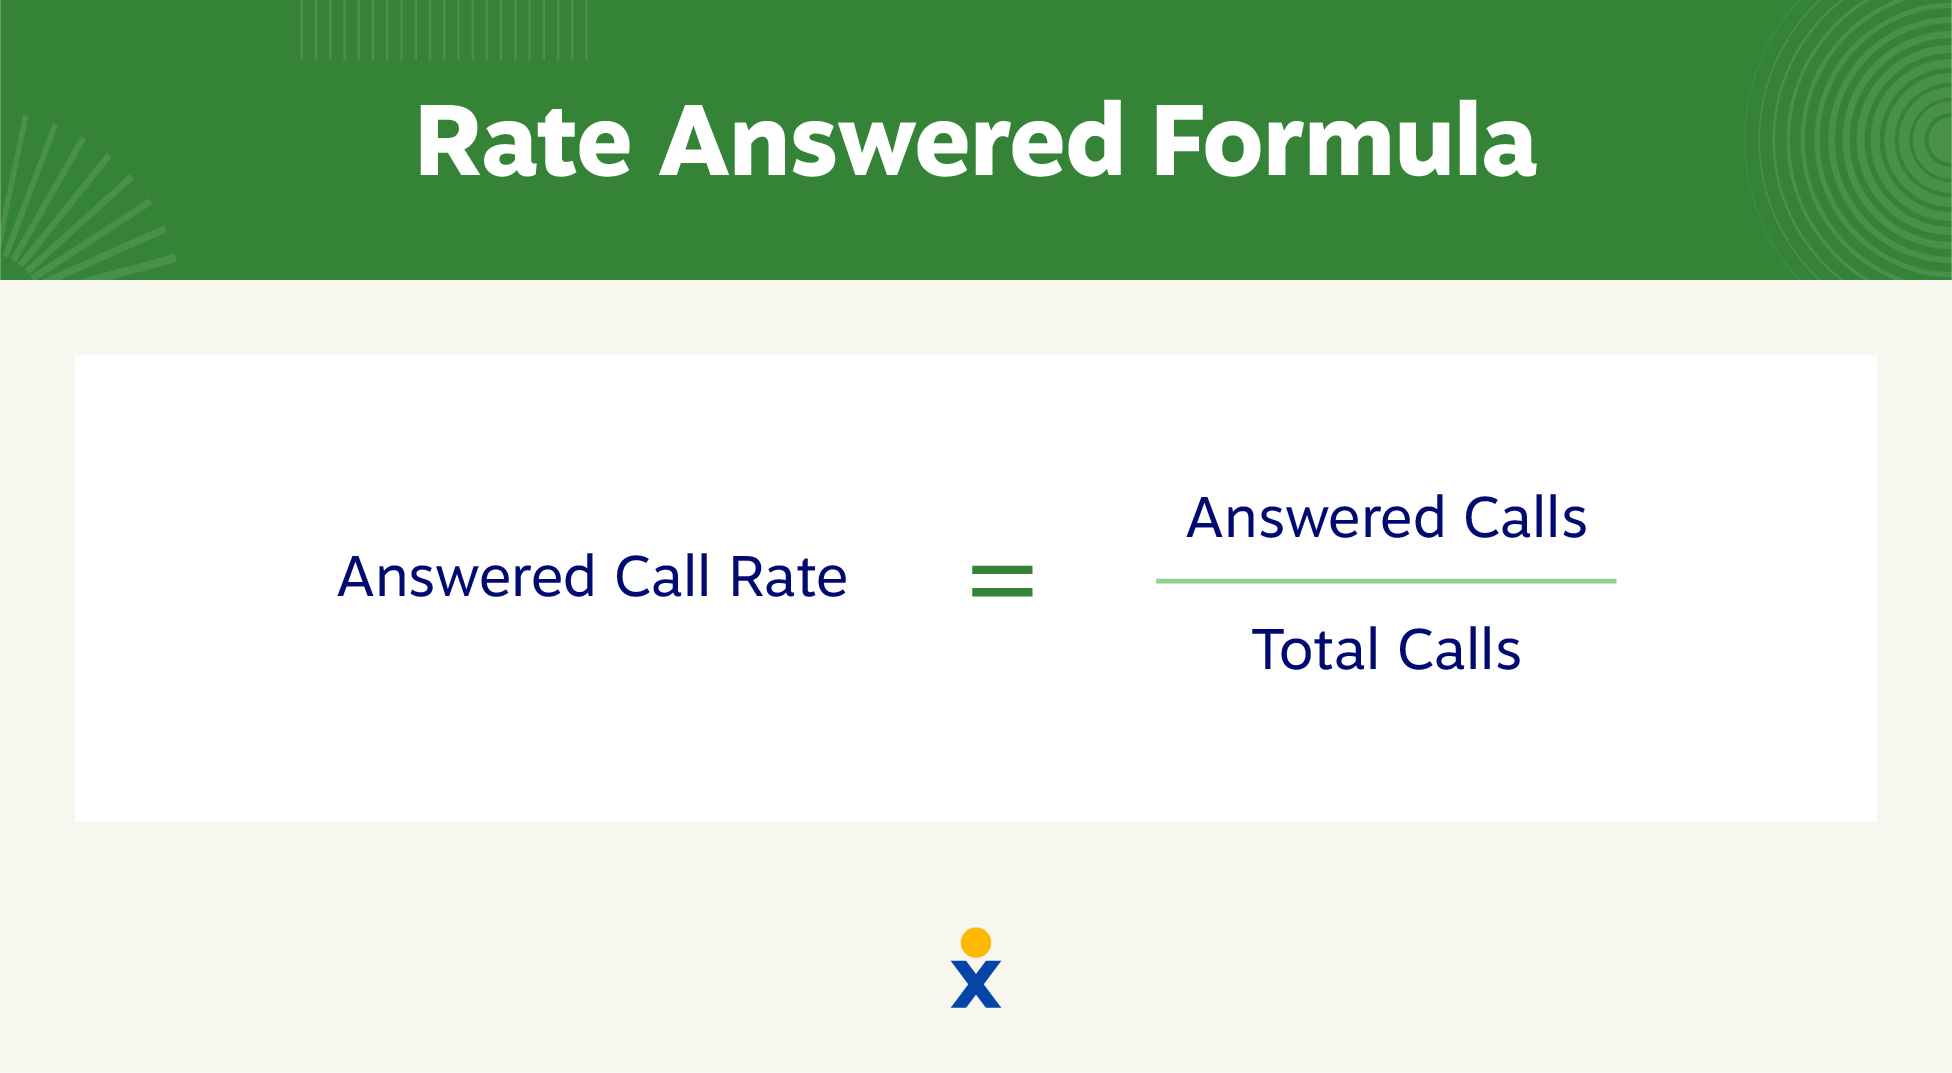
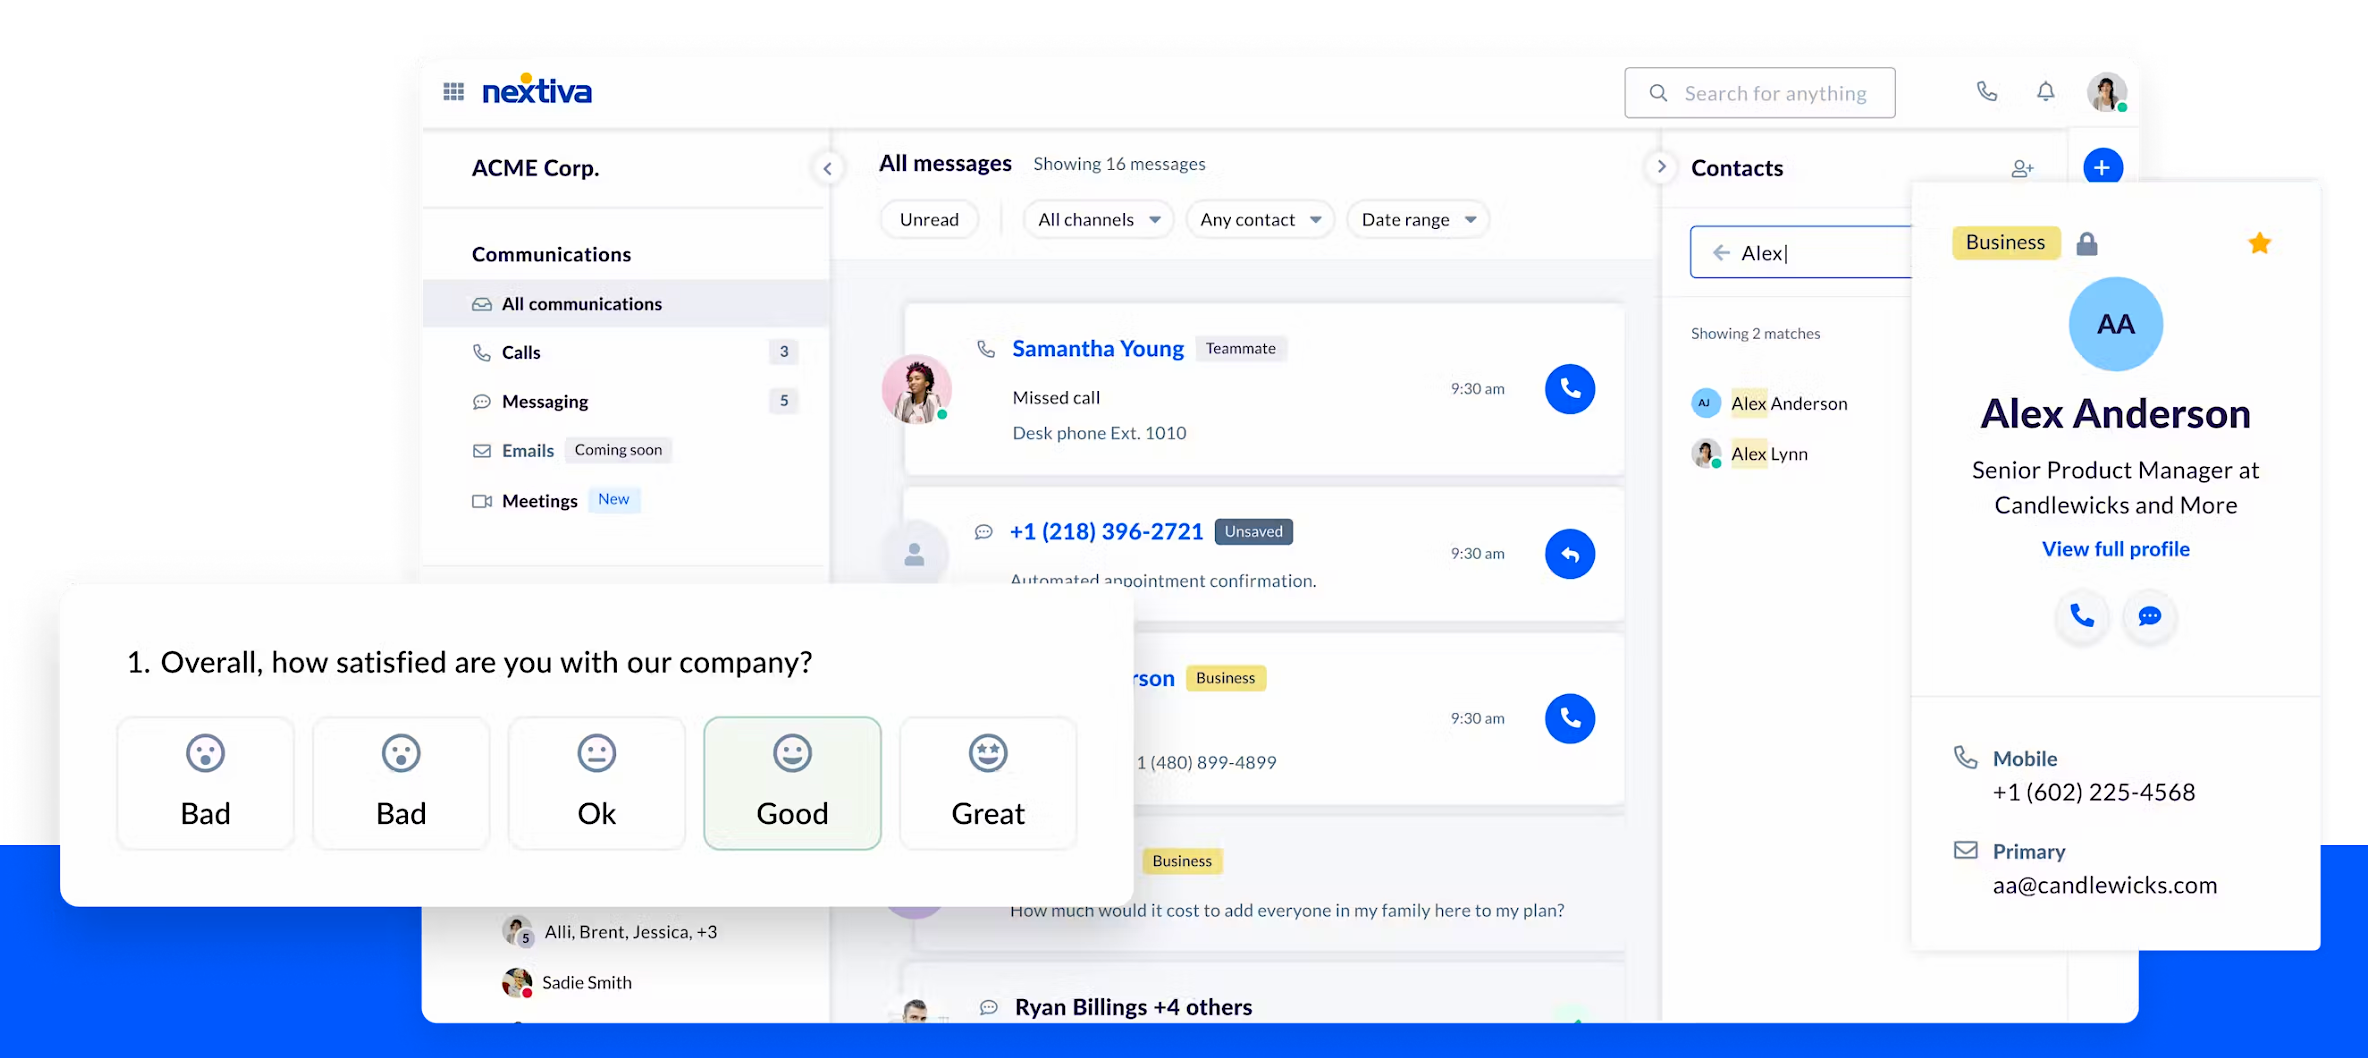
Measure your answered call rate to watch out for any spikes in customer dissatisfaction. If you use landlines, it can be hard to keep track of these metrics. But with VoIP and Nextiva’s Service CRM, call tracking happens automatically.
Check out this breakdown of the rate of answered and missed calls:
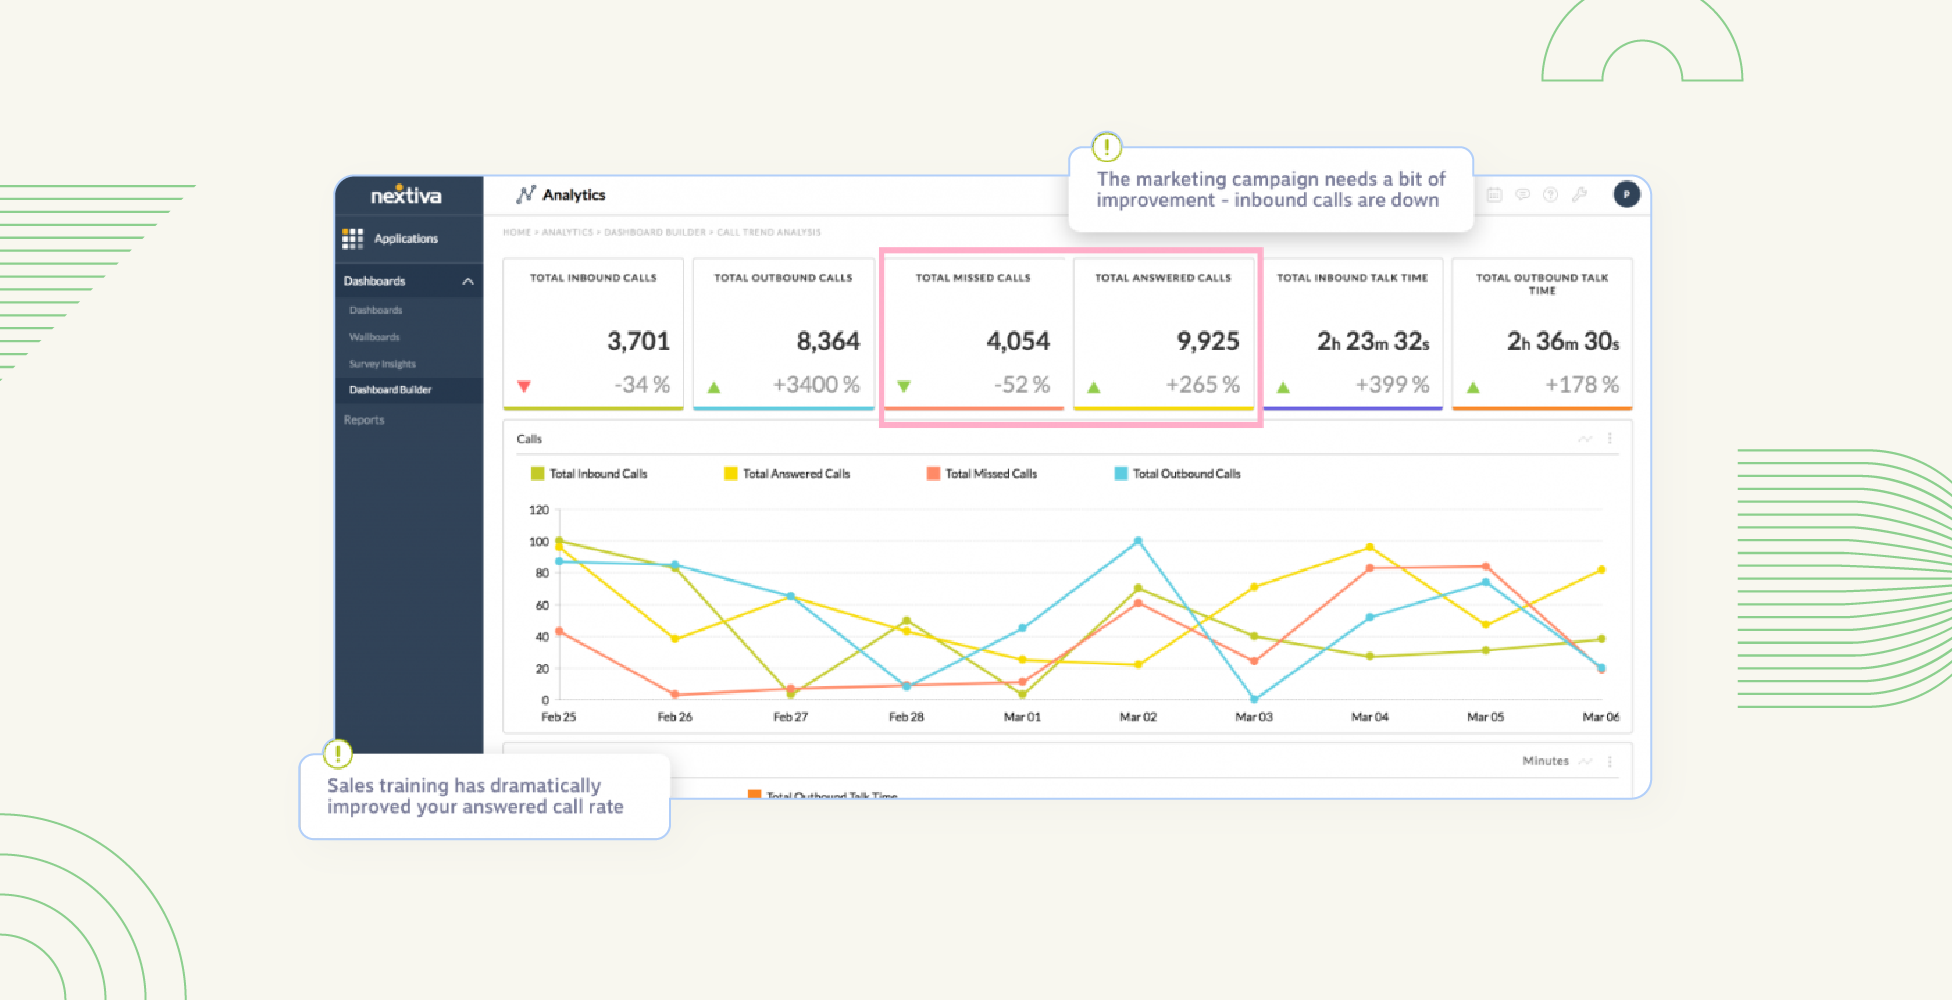
| 💡How to improve it: Use self-service resources like FAQs to help you triage high call volumes and reduce less urgent customer calls. |
3. First Contact Resolution (FCR) Rate
Also known as first call resolution, first contact resolution rate measures the percentage of customers that have their problem solved on the first call.
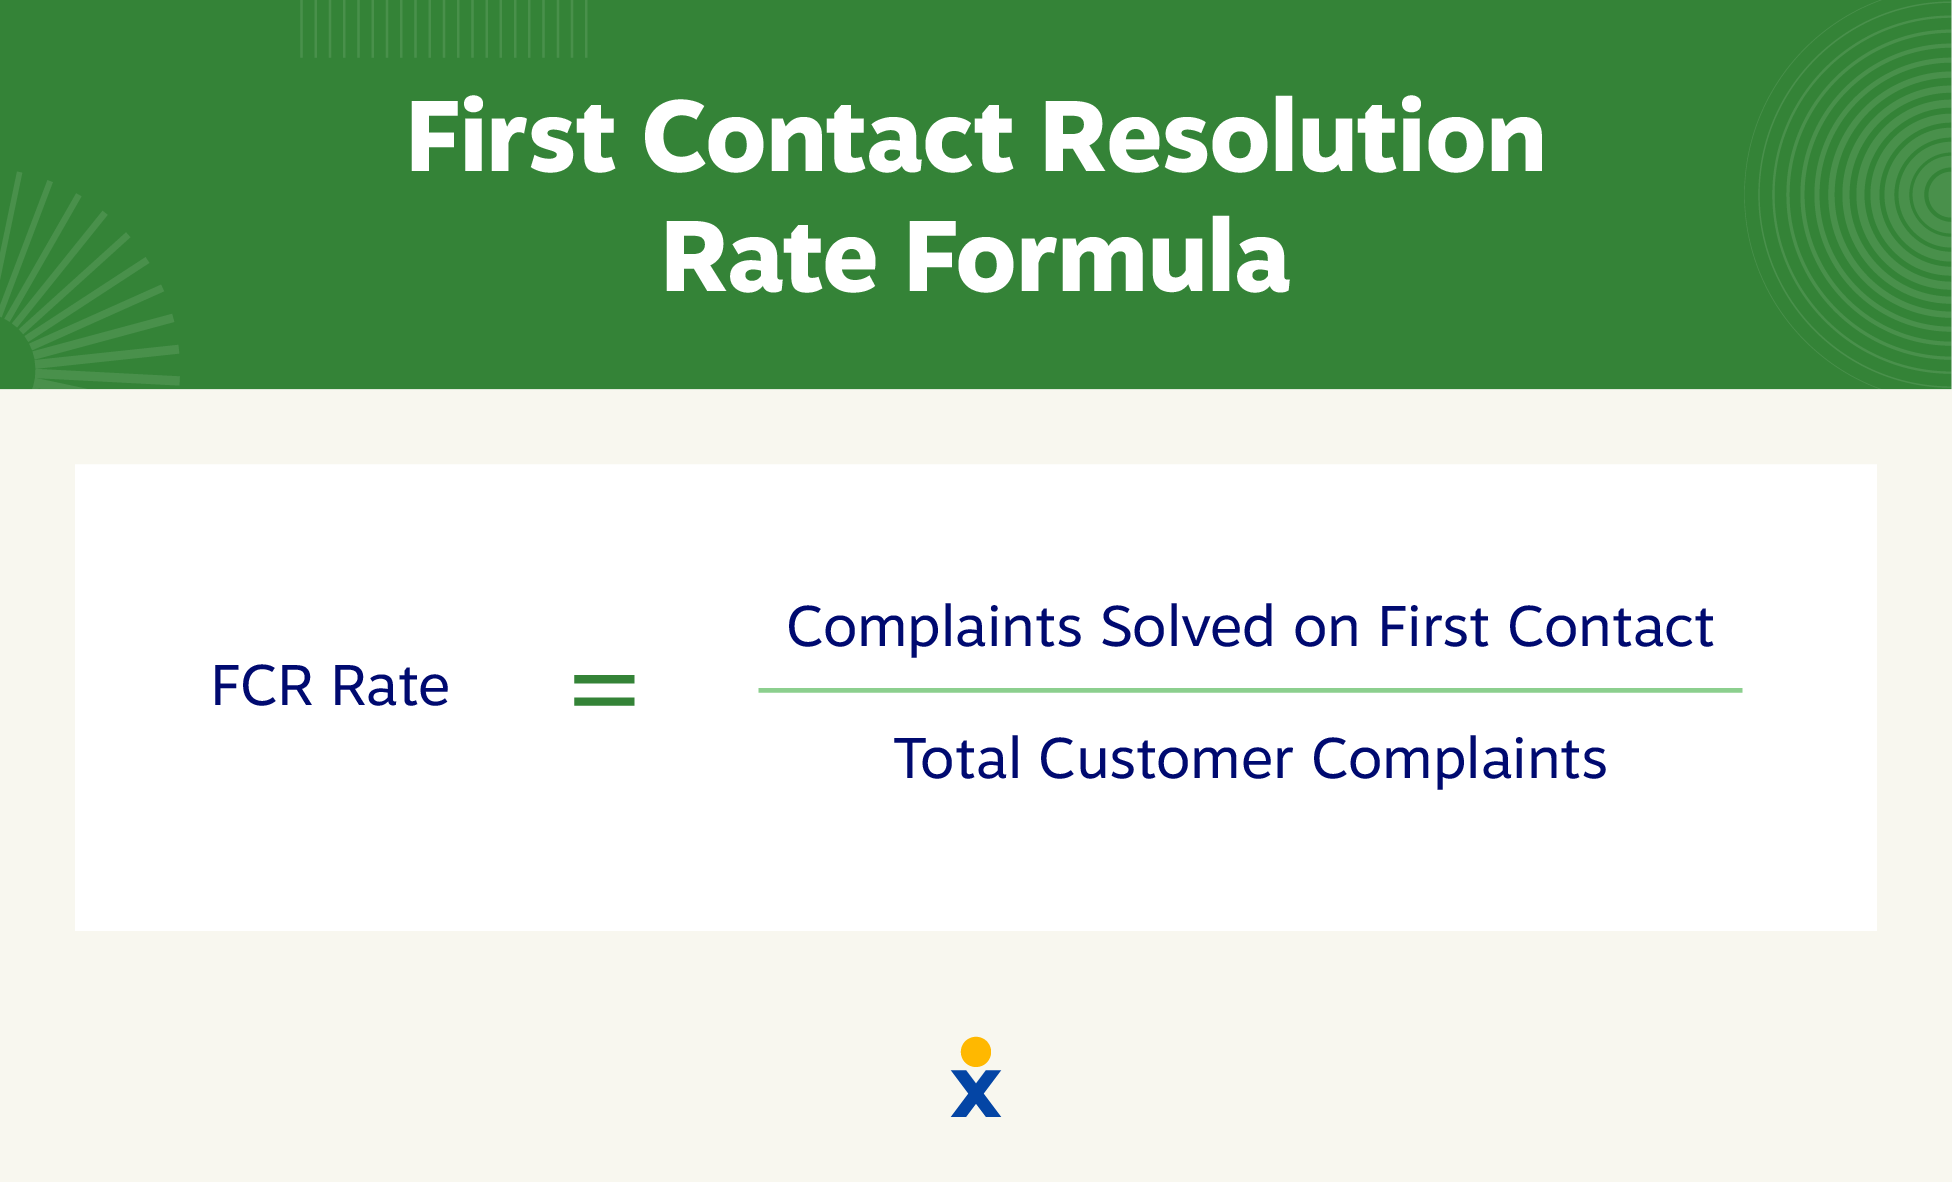
FCR can be tricky to measure without a proper CRM system.
If you only measure phone numbers, you could dilute your data with calls from the same customer about different issues. If they call from two different phones or reach out through another channel, you’ll record two different customers.
FCR is also a key call center metric that captures a more nuanced customer annoyance: disappointment. If they don’t ever reach an agent, they’ll start getting impatient. But if they get through to an agent and don’t solve their problem, they may become disappointed and annoyed.
That’s why tracking the customer journey across all channels is crucial by using state-of-the-art tools.
| 💡How to improve it: Get the right calls to the right people at the right time by using conversational AI prompts to quickly route calls to different teams. |
4. Call Service-Level Agreement (SLA)
A call SLA is an internal goal or rule for your level of service. Your agents have to answer a set percentage of calls within a defined time, like 60 seconds.
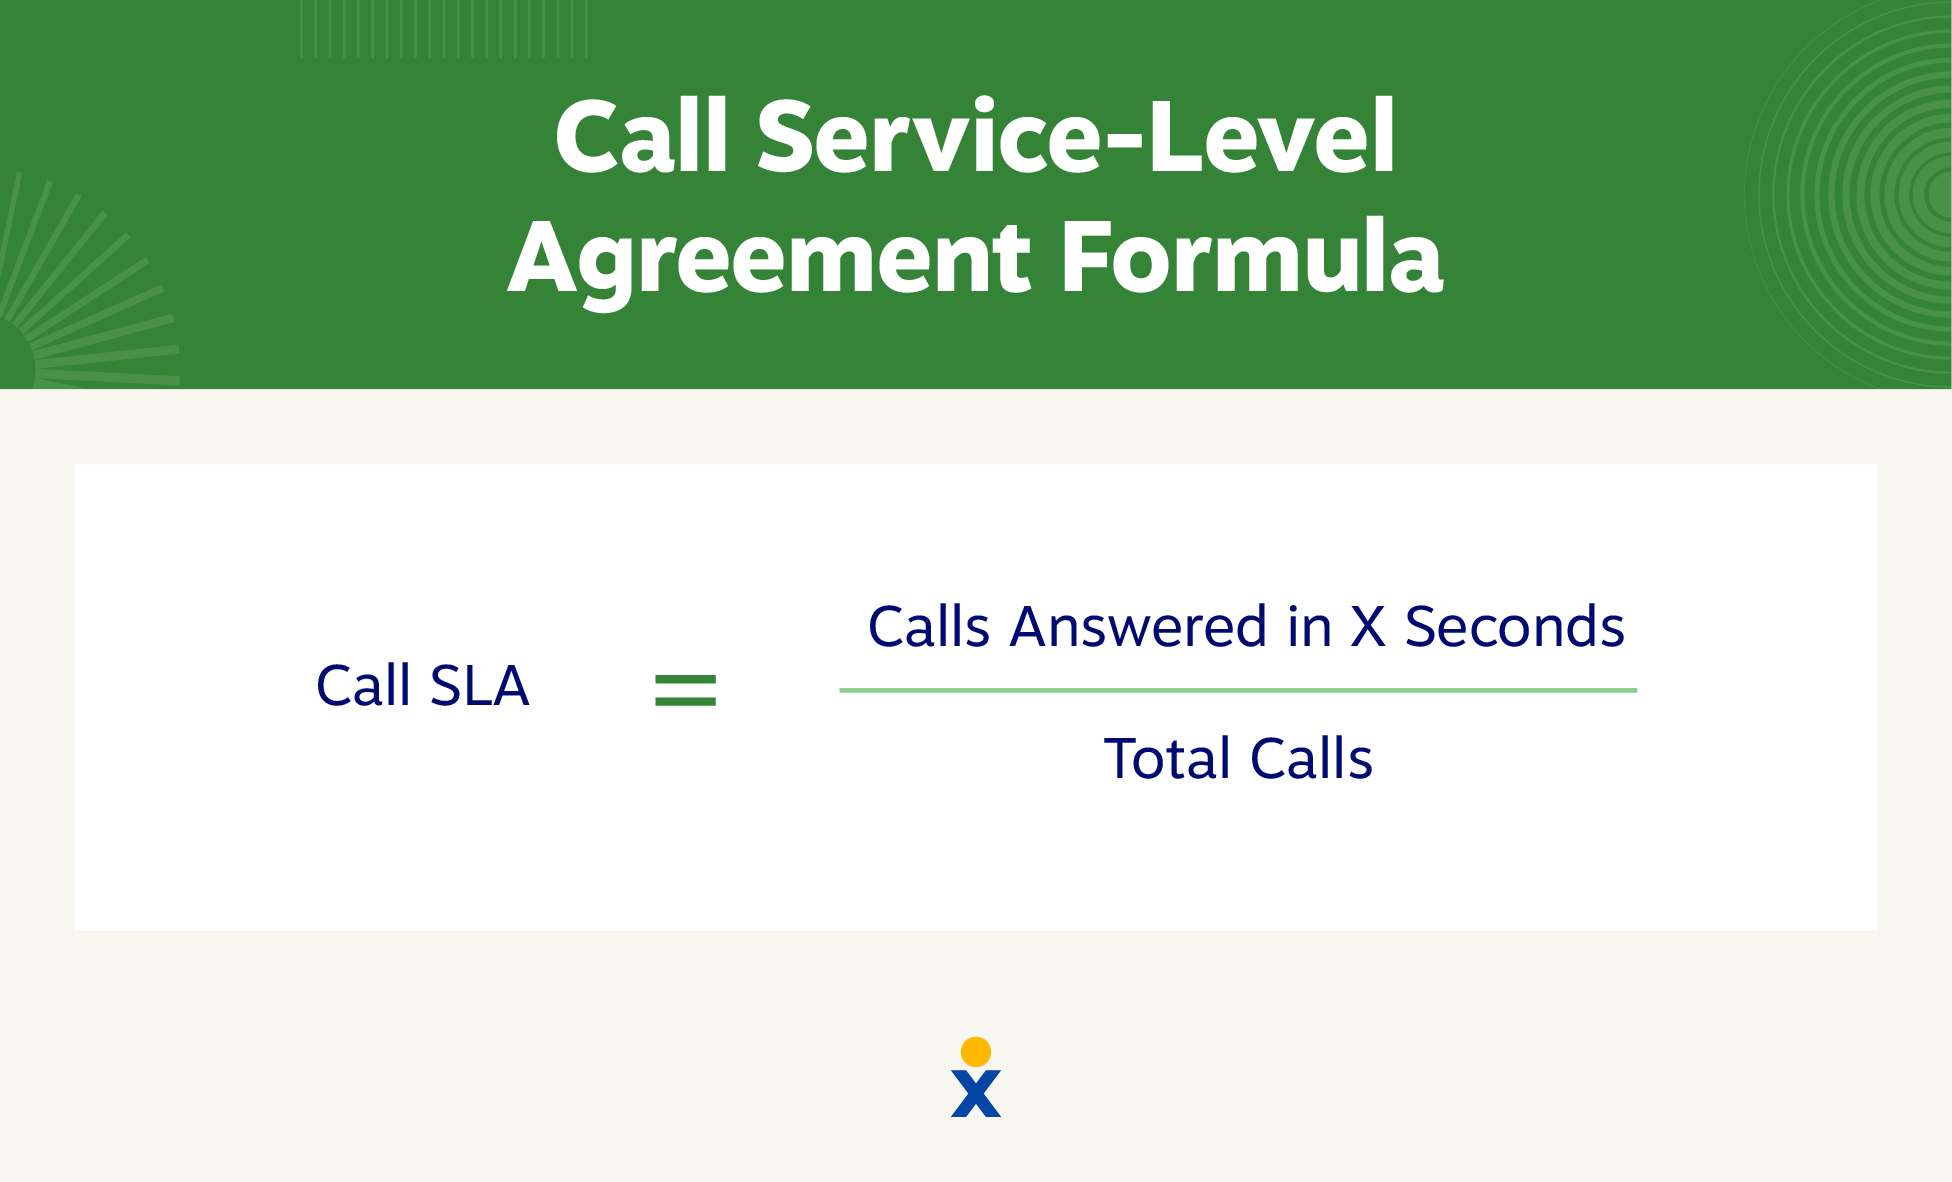
Many businesses prefer SLAs to average wait time as a performance metric. This way, they can eliminate outliers and focus on the vast majority of calls they answer.
SLAs can illustrate where companies need to focus, like efficiently pooling their resources around high-demand times and letting a small number of calls during odd times go unanswered.
| 💡How to improve it: Monitor customer calls for quality and efficiency to address slowdowns like repetitive, simple questions that could be answered with an FAQ. |
5. Average Handle Time (AHT)
Average handle time (AHT) measures call center efficiency via the average amount of time a customer spends on a call from start to finish.
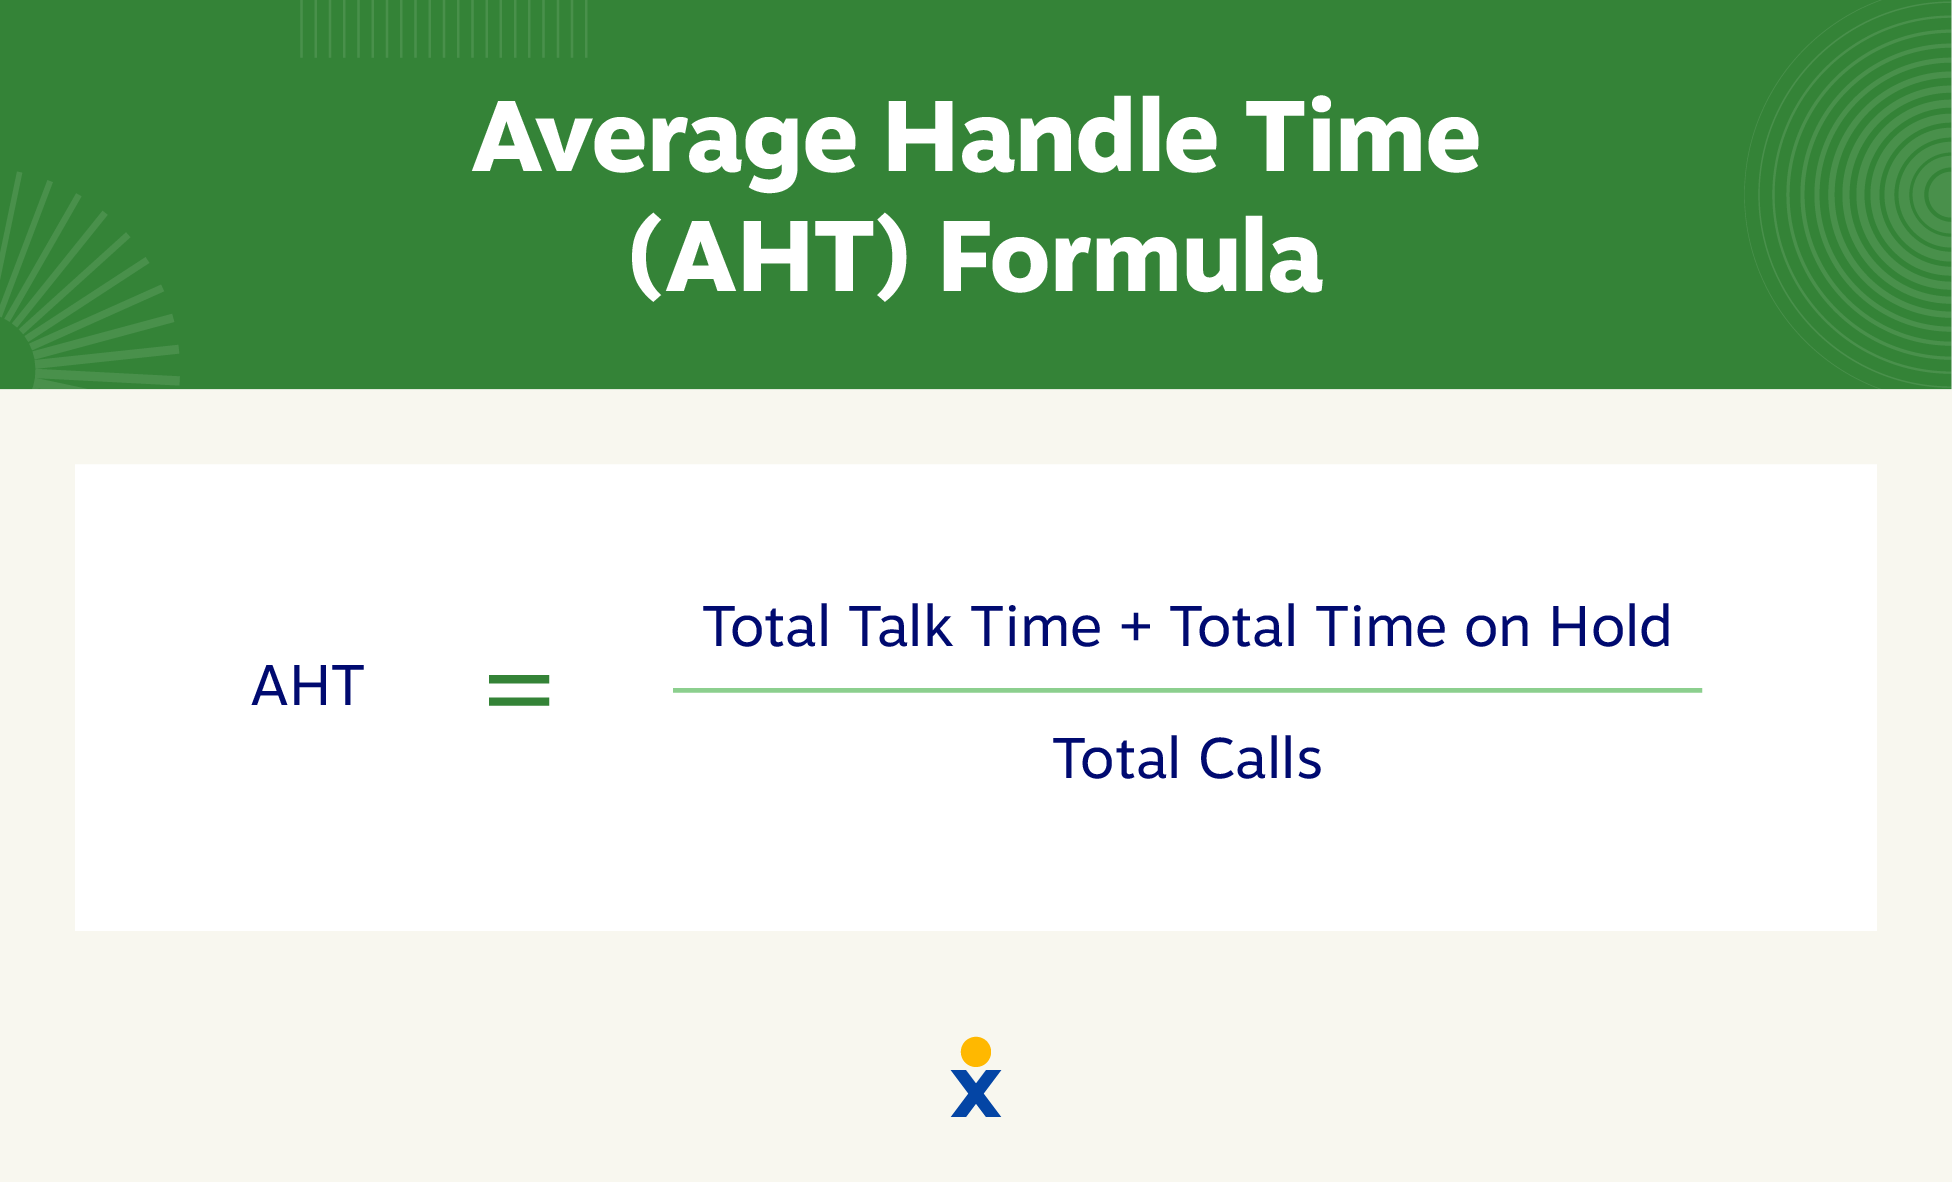
You can also use AHT to evaluate individual agent and team performance. Longer AHT for an individual might spotlight a coaching opportunity, while lower AHT across a team may indicate a training need.
| 💡How to improve it: Introduce automations to tackle demanding agent tasks, including following up on customer messages. |
6. Average Interactions per Ticket
Average interactions per ticket show how often a customer contacts support over the same issue.
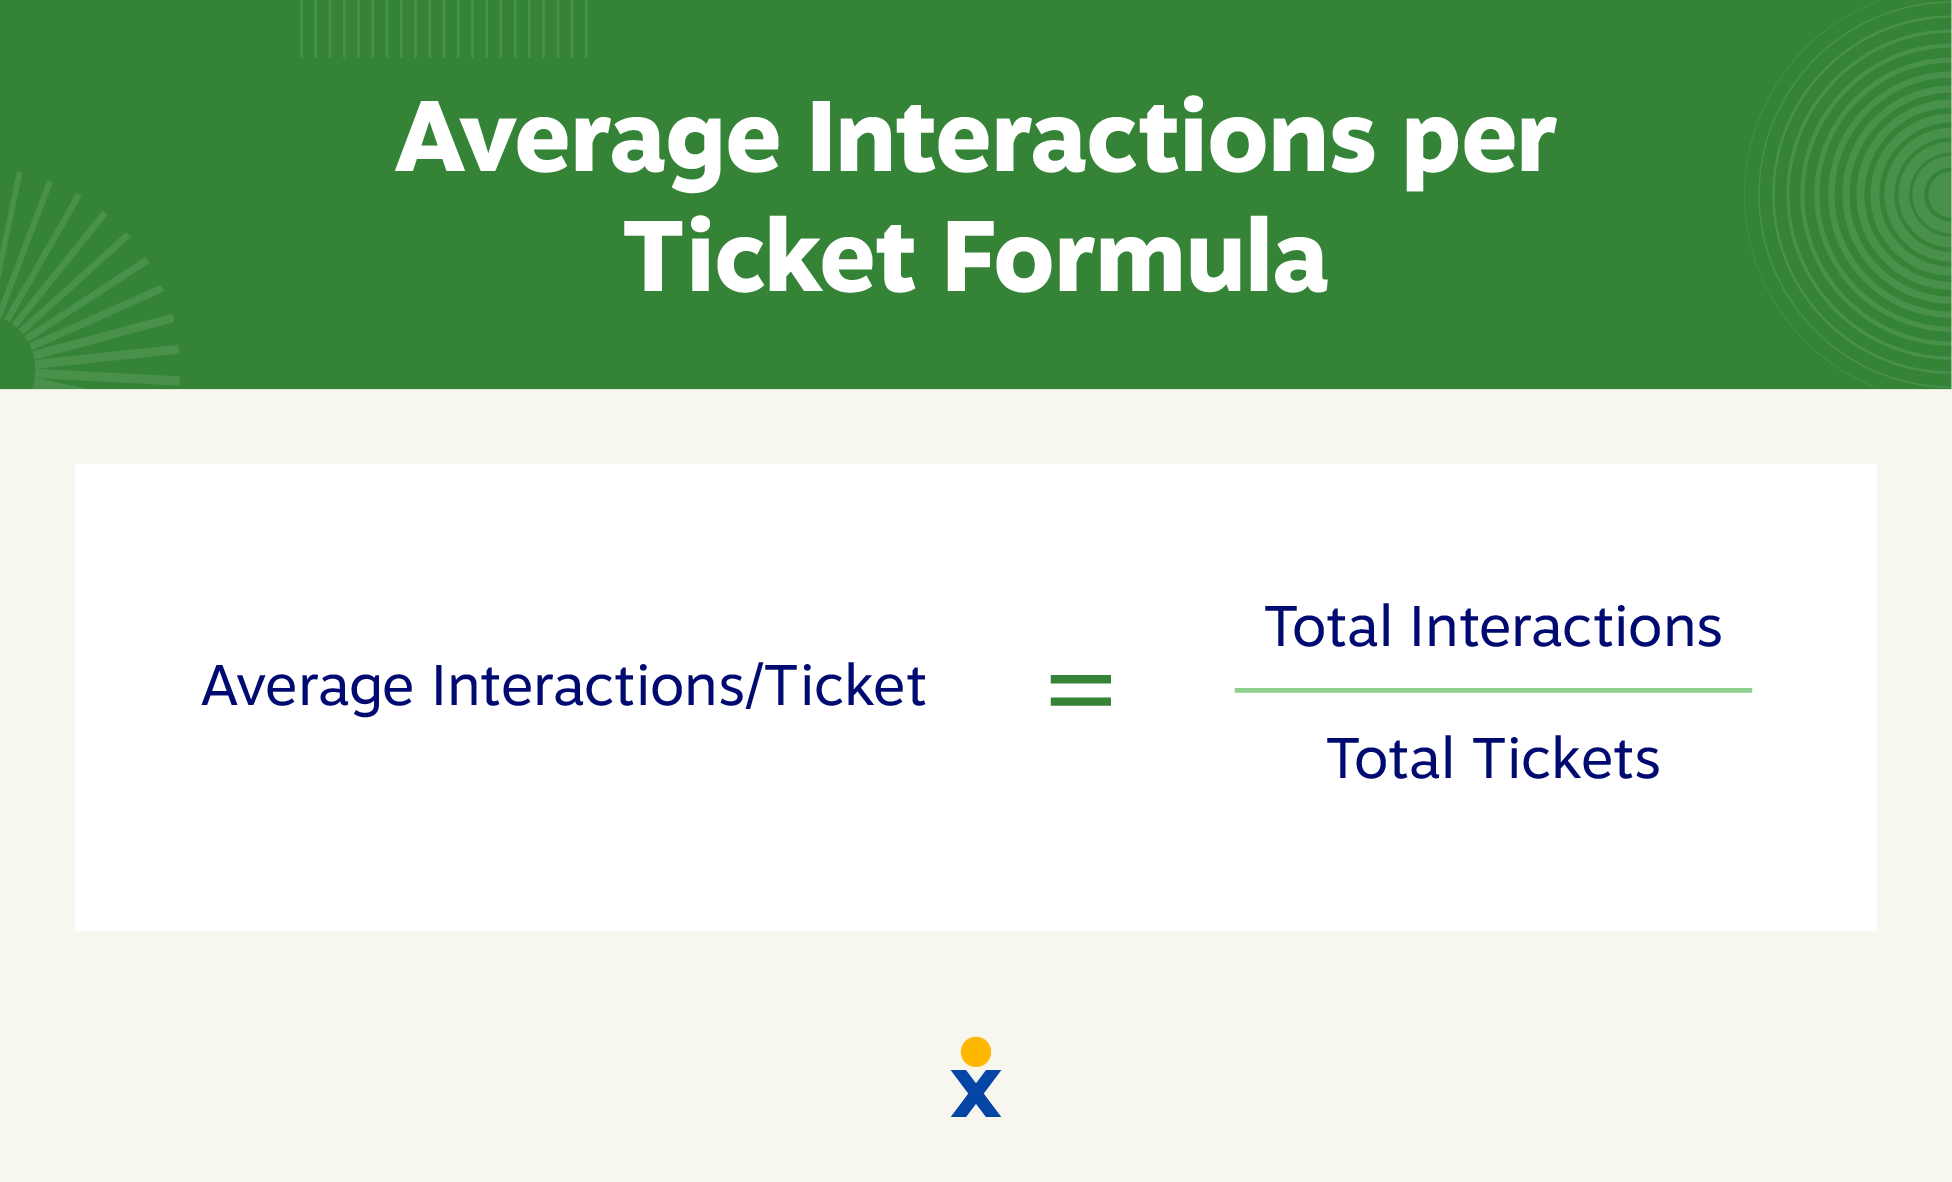
Without a CRM that keeps track of customer profiles across channels, the average interactions per ticket are difficult to record. Most businesses will want to track average interactions per ticket to flag customers who might have had a negative experience.
| 💡How to improve it: Use self-service tools like FAQs and video tutorials to help reduce customer inquiries and potentially lower average interactions per ticket over time. |
7. First Response Time (FRT)
First response time is the average time it takes you to respond to customer inquiries.
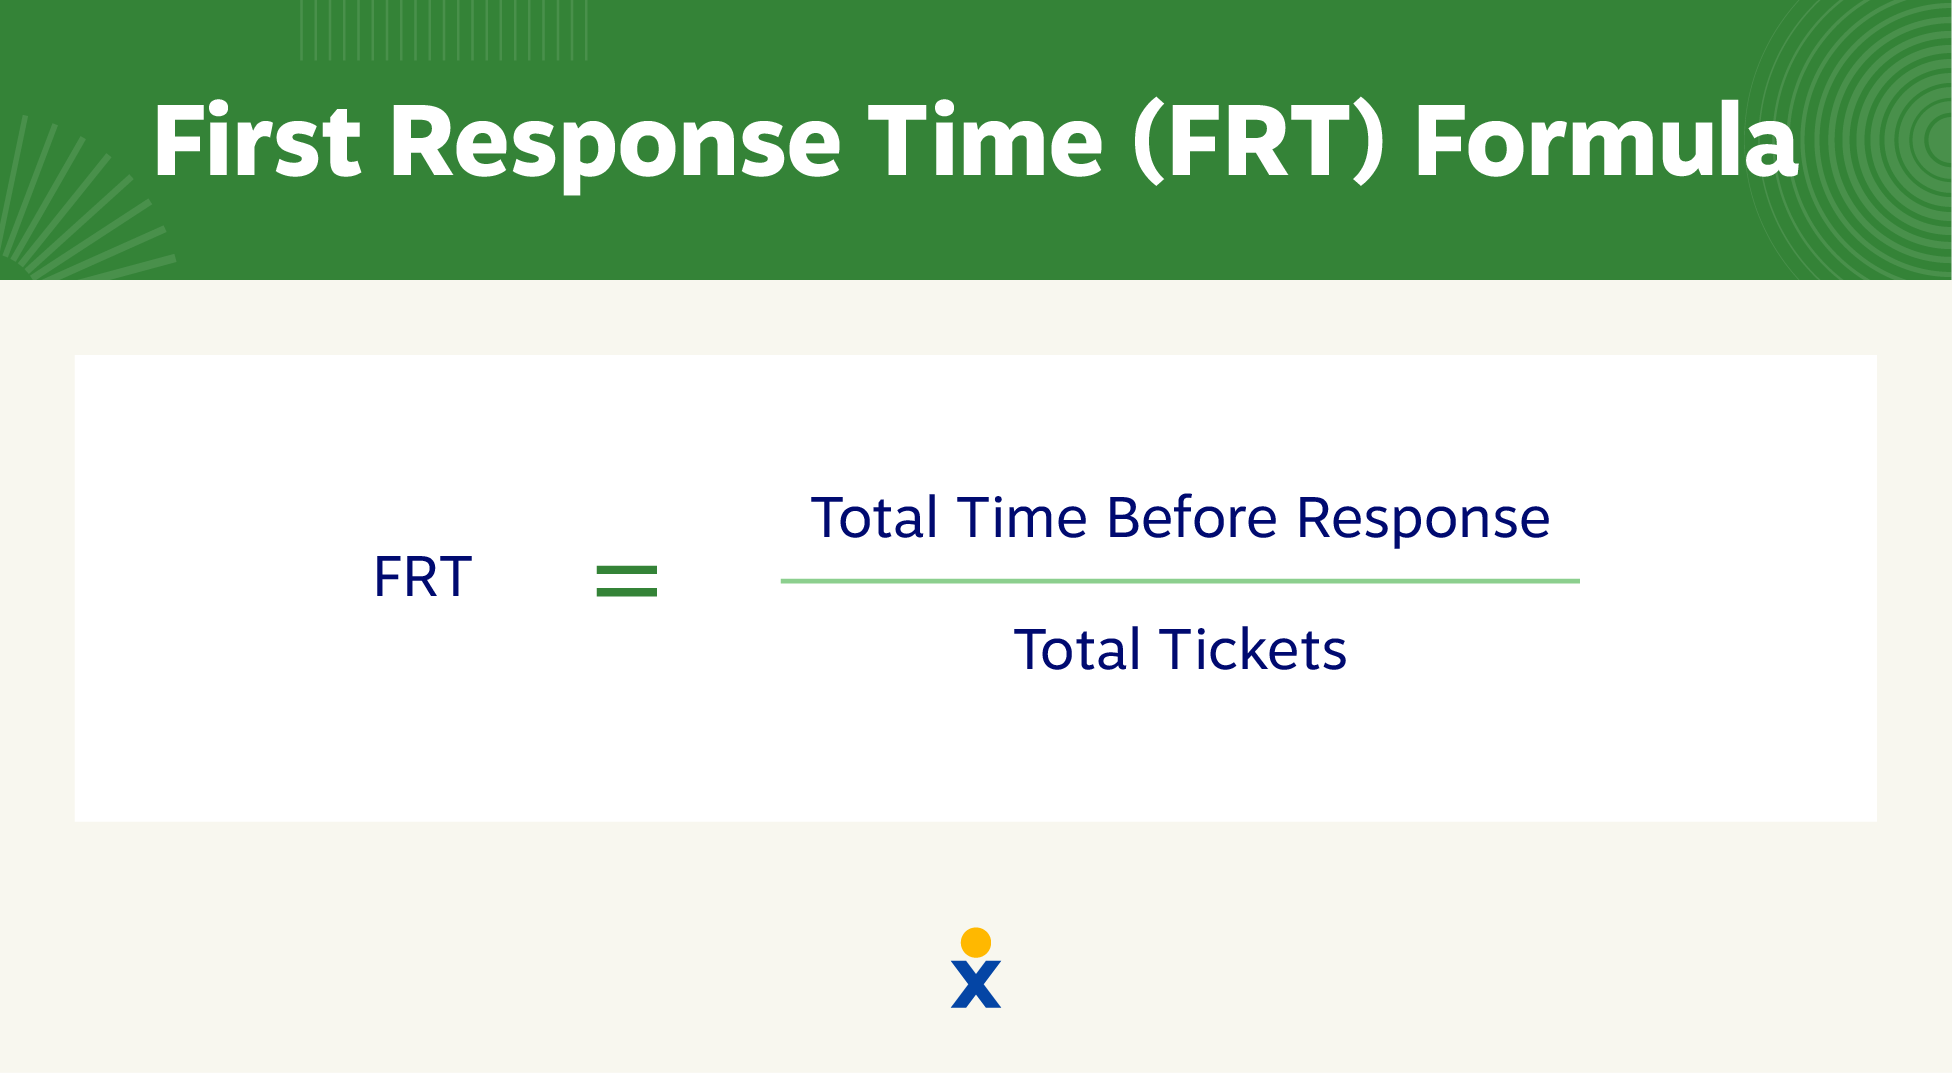
It’s vital to differentiate between communication channels when you record response times. This accounts for the different customer expectations seen in each channel. Some customers might think that a 24–48 hour email response time is acceptable, while an Instagram Message response time of more than 12 hours is unacceptable.
| 💡How to improve it: Optimize your conversational channels with chatbots to immediately engage with customers. |
8. Average Response Time
While first response time only measures the wait time until the first response, the average response time is the average time for each response to a ticket.
Since the first response time only shows the start of a customer experience, the average response time is a better measure for the entire customer journey. It indicates how quickly agents follow up, not just initiate responses.
| 💡How to improve it: Create templated customer service phrases to help your team more quickly respond to certain customer messages. |
9. Average Resolution Time (ART)
Also called time to resolution, average resolution time is the time it takes to resolve a support request from first contact.
The difference between ART and average handling time is that ART has a confirmed resolution, while AHT typically measures call length, regardless of the result.
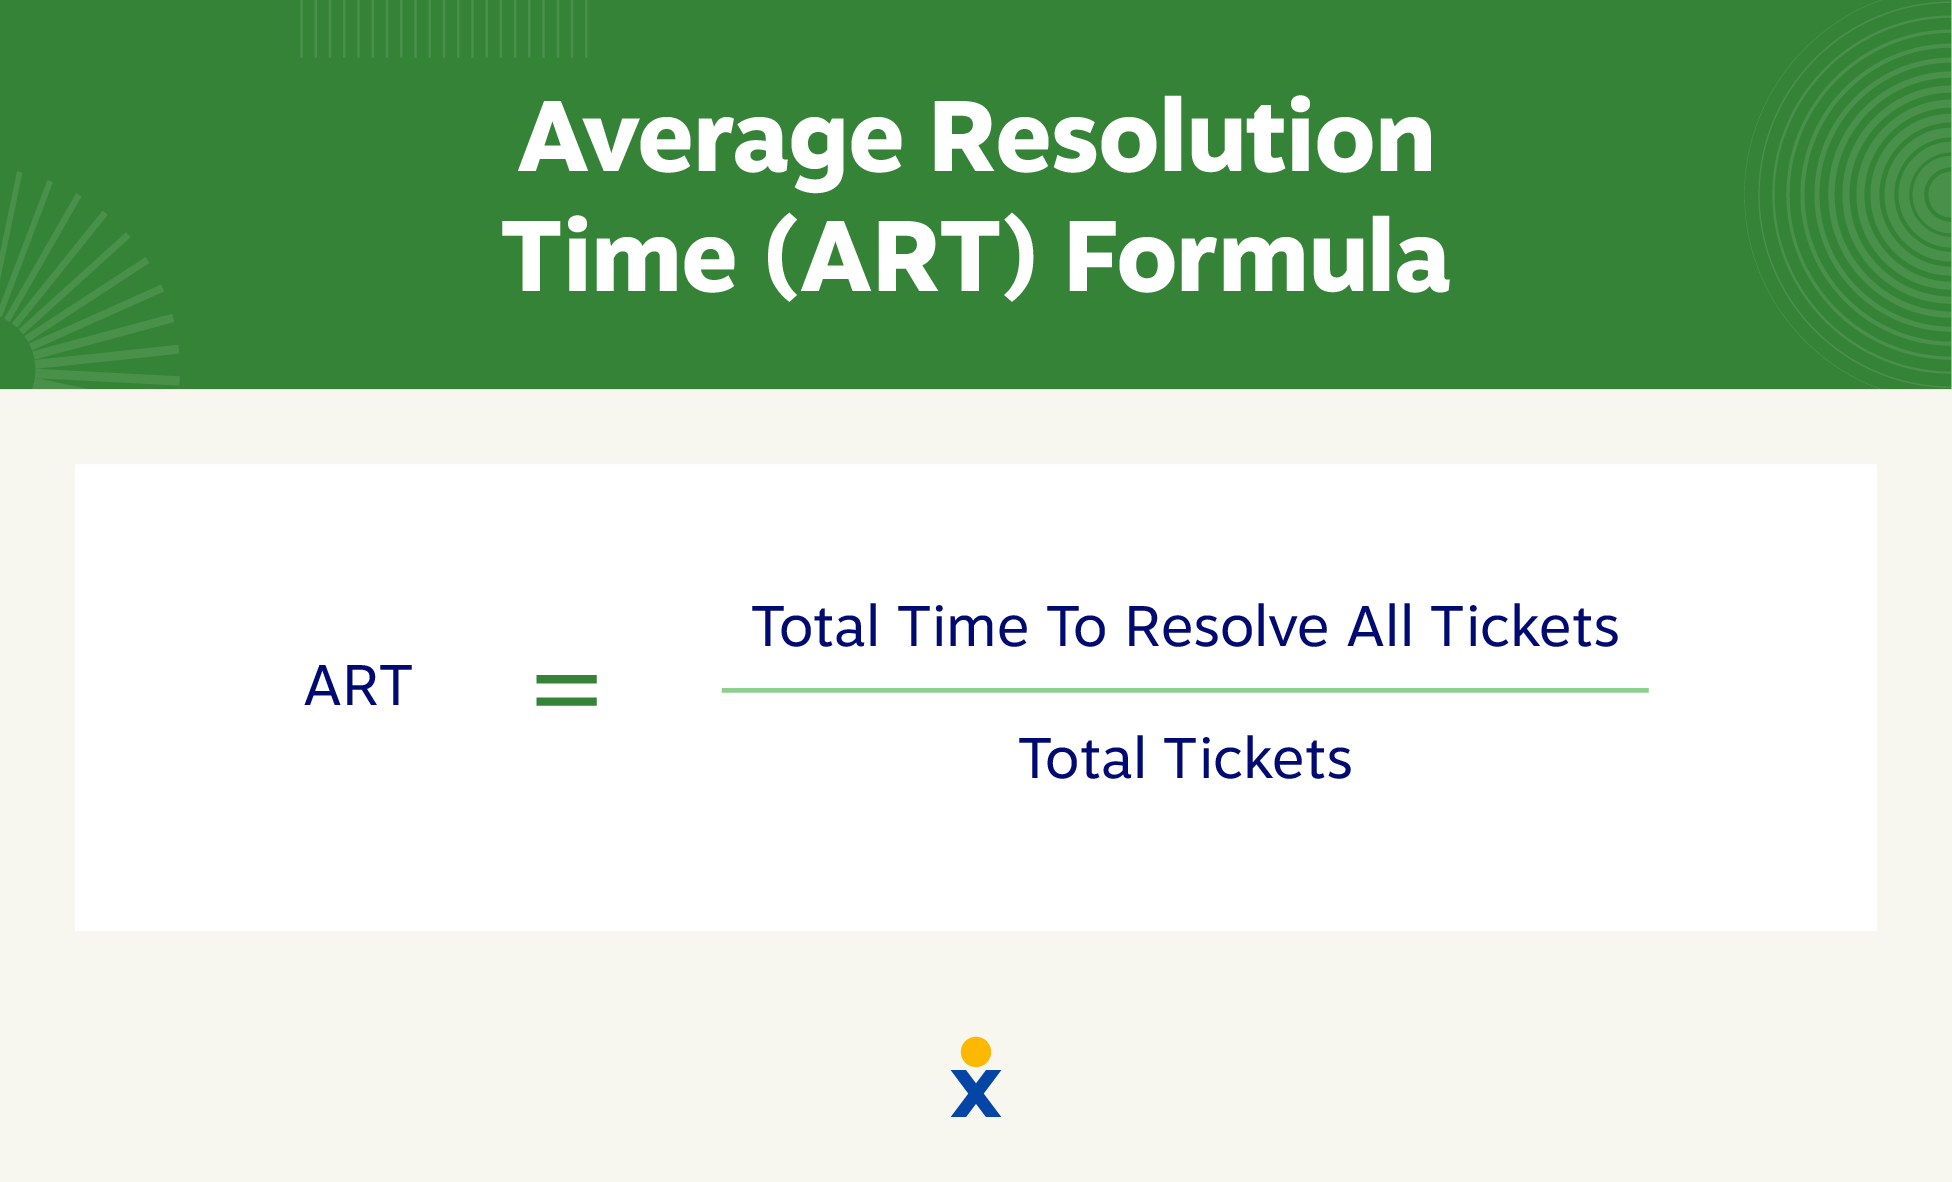
Along with metrics like first response time and average interactions per ticket, ART can show how quickly your agents solve customer problems. If ART is high, it could mean your product needs more post-sale support, lowering your customer lifetime value as you spend more time dealing with issues.
| 💡How to improve it: Use unified communication tools that allow customers to continue conversations across channels. This limits repetition and speeds up customer problem-solving. |
10. Issue Resolution Rate
Your issue resolution rate is the percentage of total issues your customer service team resolves.
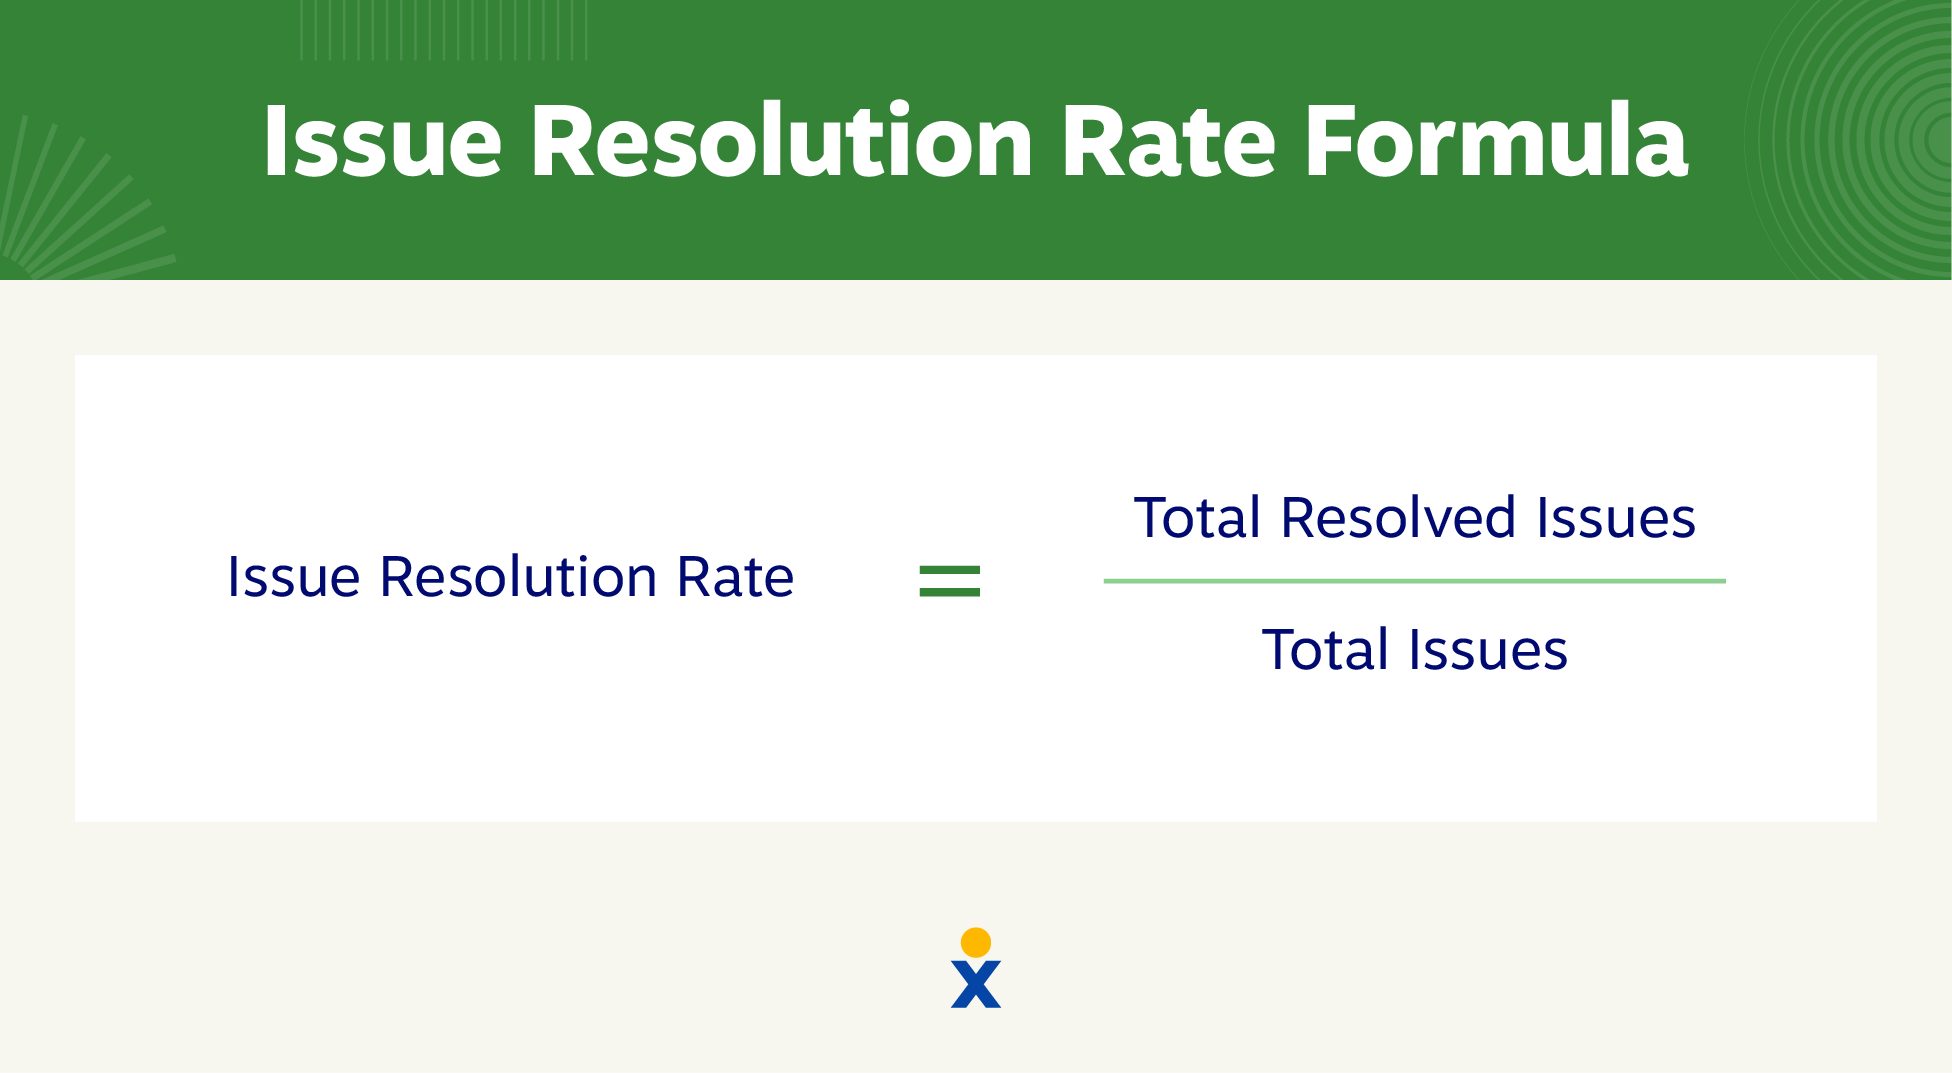
Customers who don’t resolve their issues aren’t exactly happy, so a high resolution rate is always a priority for customer service teams.
| 💡How to improve it: Decrease the number of support tickets you receive with self-service tools that enable customers to learn independently. |
11. Self-Service Usage/Success Rate
Be it a Facebook chatbot or a VoIP phone service, many companies offer self-service customer support for common issues.
Self-service usage measures what percentage of your customers take advantage of your self-service support options for these support requests.
Each of the following can contribute to your self-service usage rate:
- How much traffic visits your knowledge base or help center
- How many cases open and close without an agent
- Positive feedback on support articles, like ratings or upvotes
- How many customers elect to solve their issue with interactive voice response rather than contacting an agent.
| 💡How to improve it: Think about any problems your customer has that could be solved with one click. Then, create a CTA for them to click it. |
12. Backlog
Backlog refers to the total number of unresolved tickets. Unlike many percentage-based metrics, this number should stay as low as possible — fewer unresolved tickets probably means fewer unhappy customers.
The service level and response times you commit to customers might vary based on their customer value, though. If an enterprise customer has a ticket open more than one day, that might be escalated and actioned — but a freemium customer might have a 3-day response time.
| 💡How to improve it: Cull unresolved tickets periodically (daily, weekly, or monthly, depending on frequency) to reassess them and attempt another solution. |
13. Customer Satisfaction Score (CSAT)
Happy customers spend more and churn less. Customer satisfaction is one of the most crucial metrics to measure because it can affect what customers feel, think, and do regarding your business.
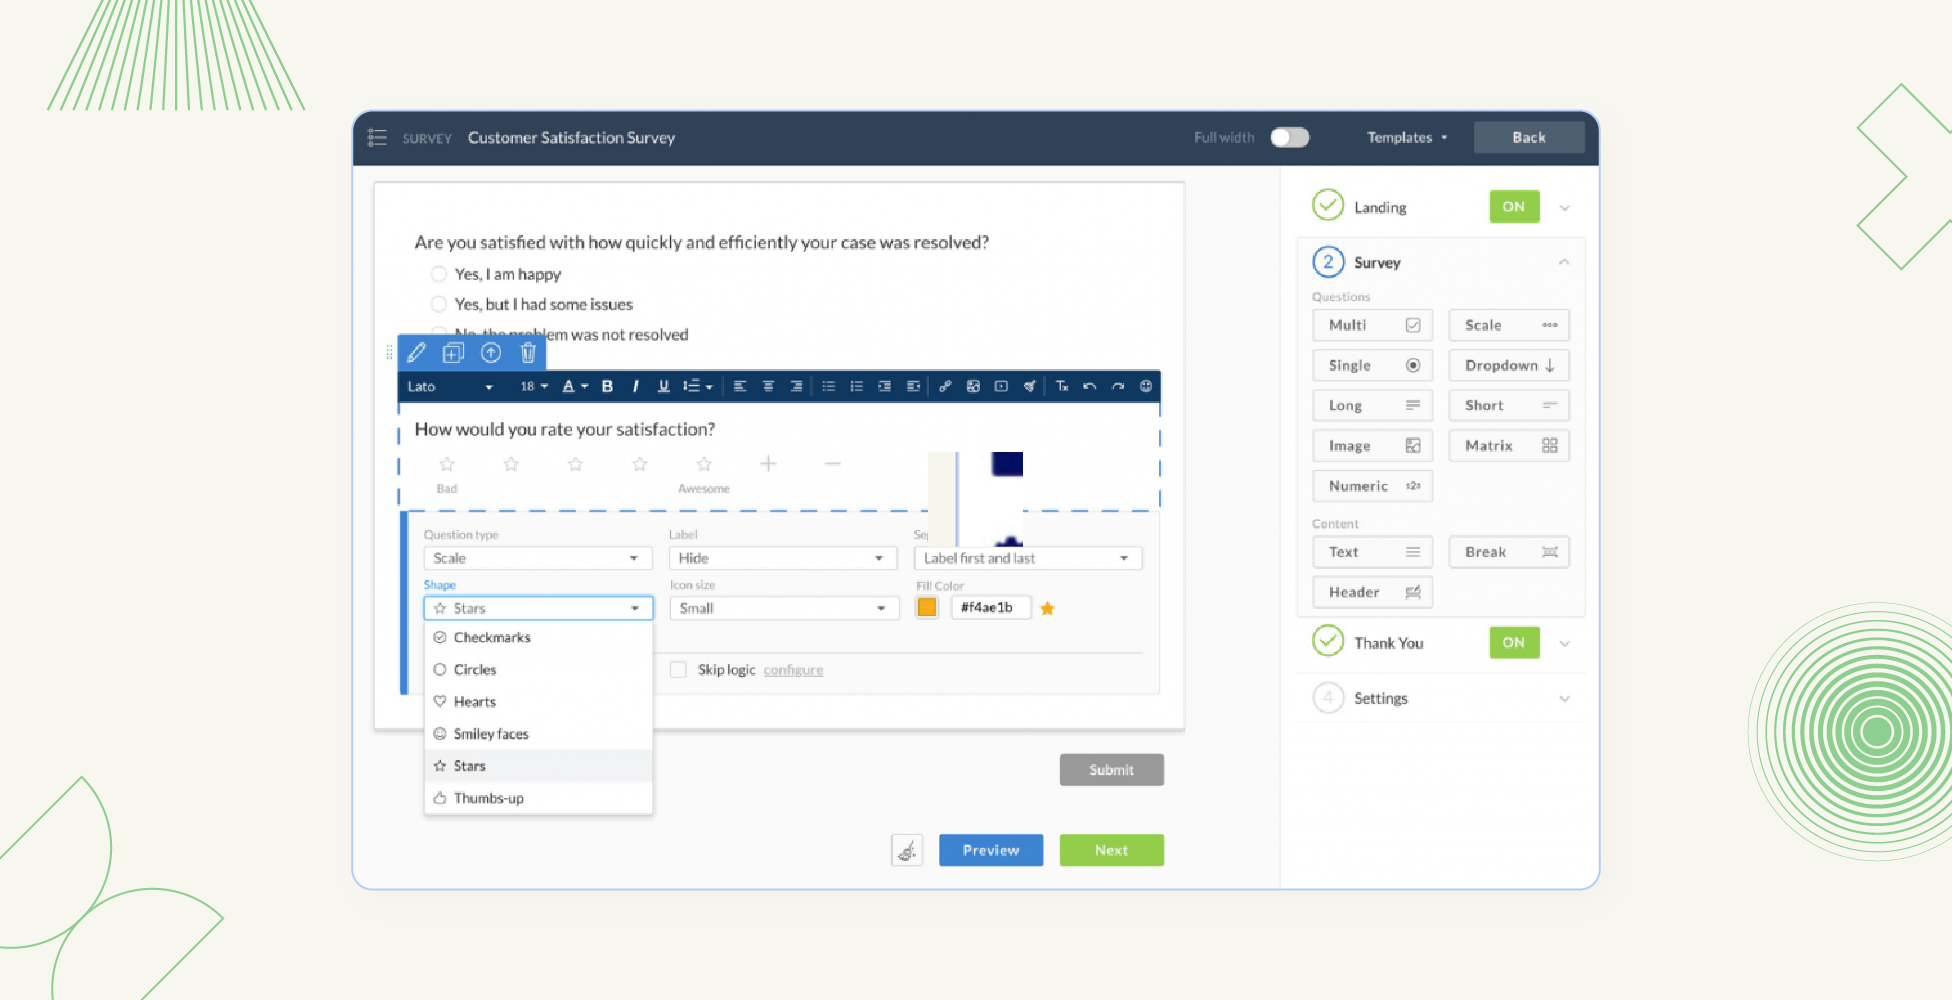
Calculate your CSAT score by giving a simple, one-question survey after a customer interaction:
“How would you rate your overall satisfaction with the service you received?”
You can vary the customer satisfaction survey question if the intent stays the same. Then, customers can respond on a scale from 1–5, 1 being Very Unsatisfied, 3 being Neutral, and 5 being Very Satisfied.
Satisfied customers score a 4 or 5.
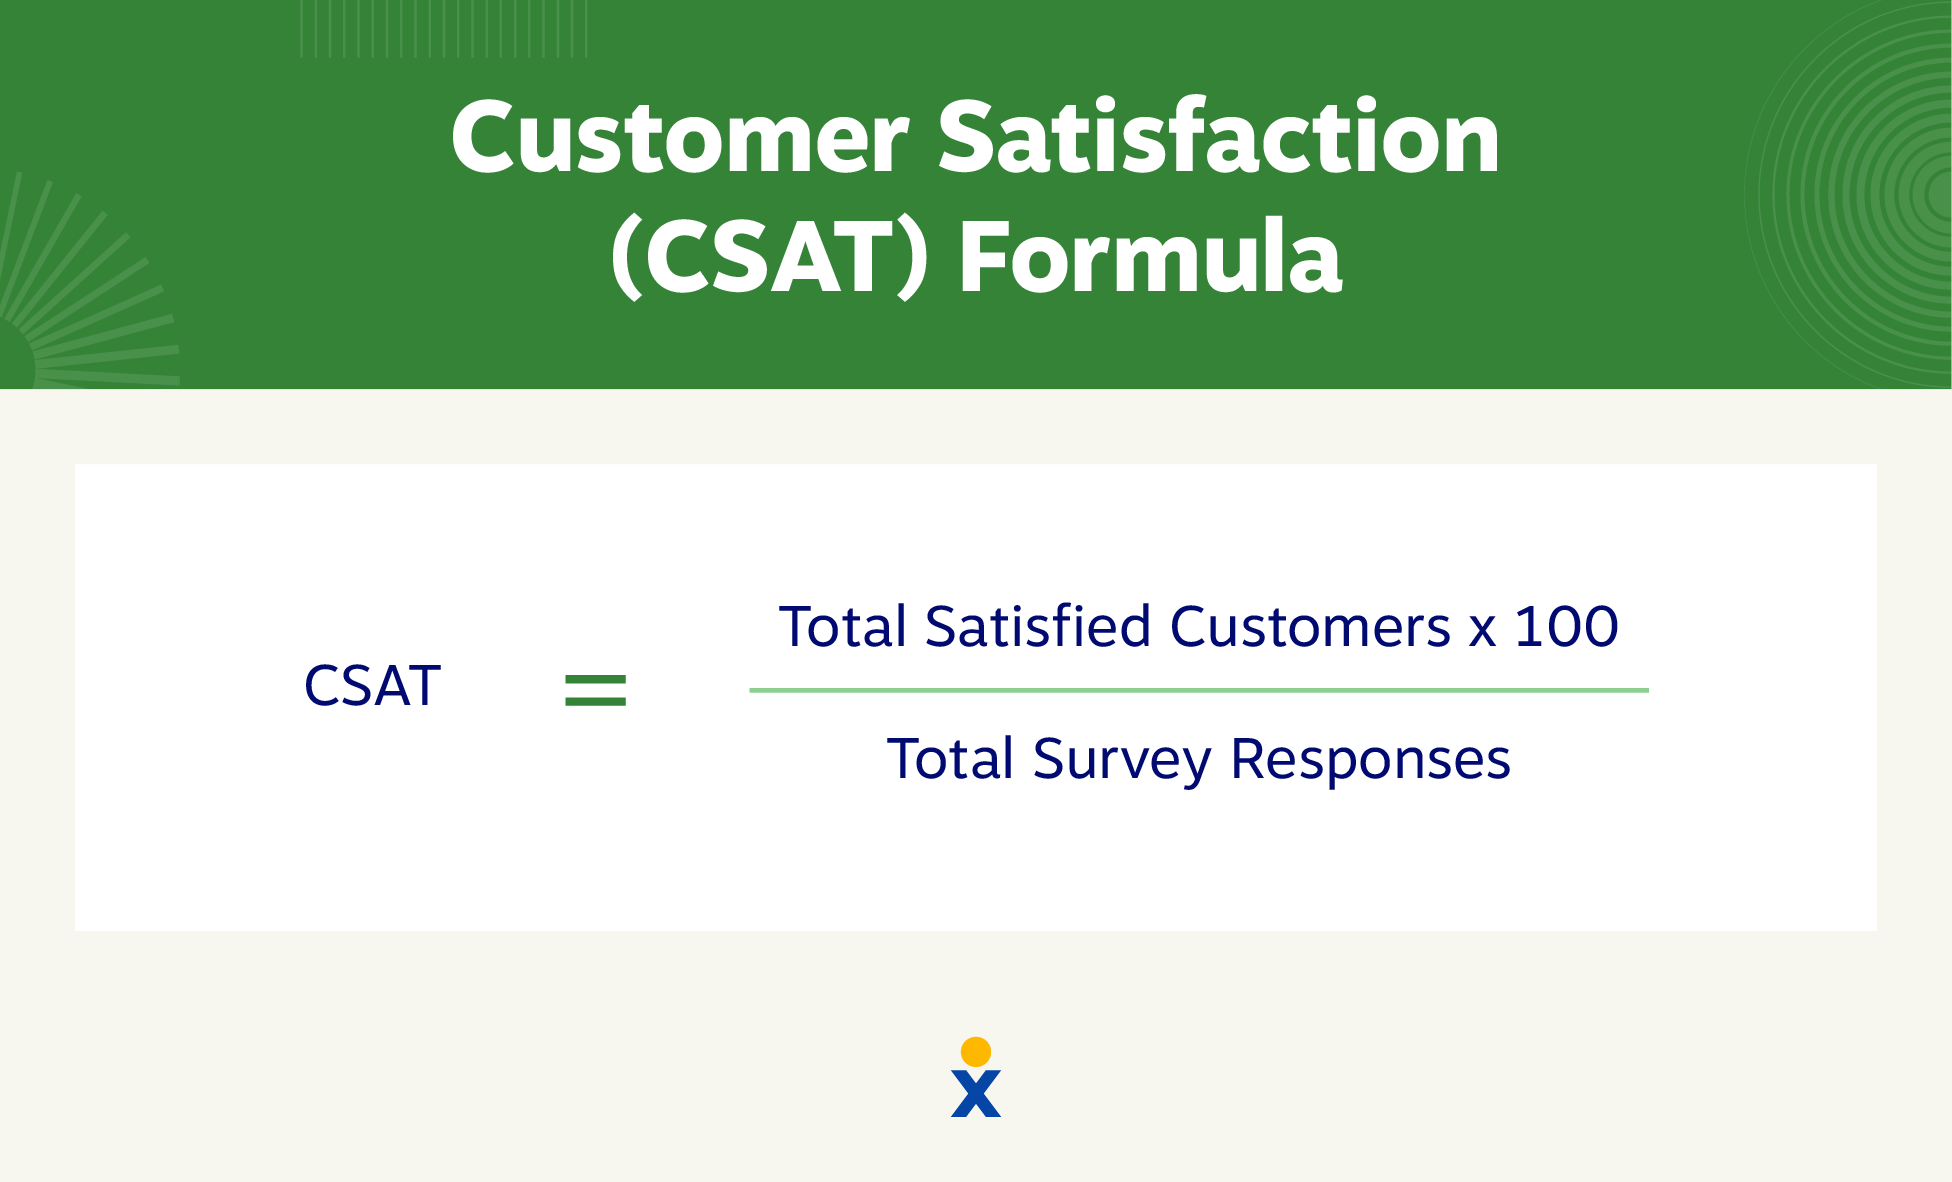
If you surveyed 100 customers and 43 answered Satisfied while 29 answered Very Satisfied, your CSAT score would be 72.
The American Customer Satisfaction Index (ASCI) publishes the CSAT scores of several major companies every year. This public data makes it easy to benchmark your scores against other companies in your industry.
With Nextiva’s inbound call center solution, you can easily handle tons of incoming calls, track team performance against benchmarks, and generate more revenue. You can even see customer sentiments in real time with built-in CRM.
| 💡How to improve it: Focus on a top-notch customer service strategy with the right communication tools at your side to increase satisfaction across the board. |
14. Net Promoter Score® (NPS)
The Net Promoter Score is a survey-based metric that aims to show how likely a customer is to recommend your business.
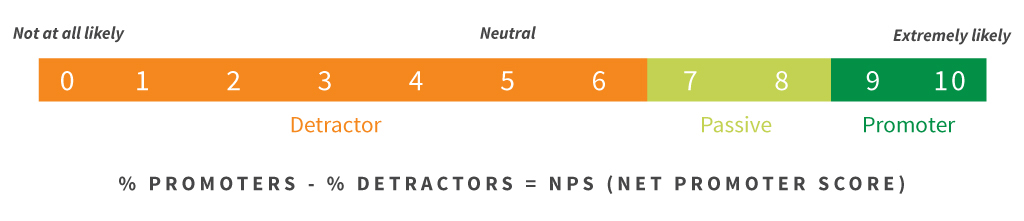
Unlike the CSAT survey, it’s not necessarily asked right after a service interaction. The NPS survey can be sent to the customer at any point after purchasing your product or service.
Some consider NPS a staple for SaaS businesses and apps, and businesses often use it when forecasting organic growth. Like the CSAT, it’s one question:
“How likely is it that you would recommend [BRAND] to a friend or colleague?”
Answers are usually on a scale from 1–10. To NPS, you divide the results into three categories:
- Detractors (Scores 0–6)
- Passive (Scores 7–8)
- Promoters (Scores 9–10)
Subtracting the percentage of Detractors from the number of Promoters. If you surveyed 100 customers and 70 answered 9–10, 20 answered 7–8, and 10 answered 1–6, your NPS would be 60.
| 💡How to improve it: Quickly reducing first-impression metrics like hold time, response time and resolution time can encourage customers to recommend you. |
15. Customer Effort Score (CES)
The Customer Effort Score is another single-question, survey-based metric. This one is from 1–7, and asks:
“To what extent do you agree or disagree with the following statement? ‘The company made it easy for me to handle my issue.’”
Then, the answer scale ranges from 1 (strongly disagree) to 7 (strongly agree). Total CES is the average of all the answers.
| 💡How to improve it: Reduce the number of customer issue tickets (like adding self-service resources) and lower average resolution time to encourage higher CES responses. |
16. Customer Churn
For any high-growth service business, customer churn is a vital metric. Churn is the percentage of your customers that leave during a specified time frame.
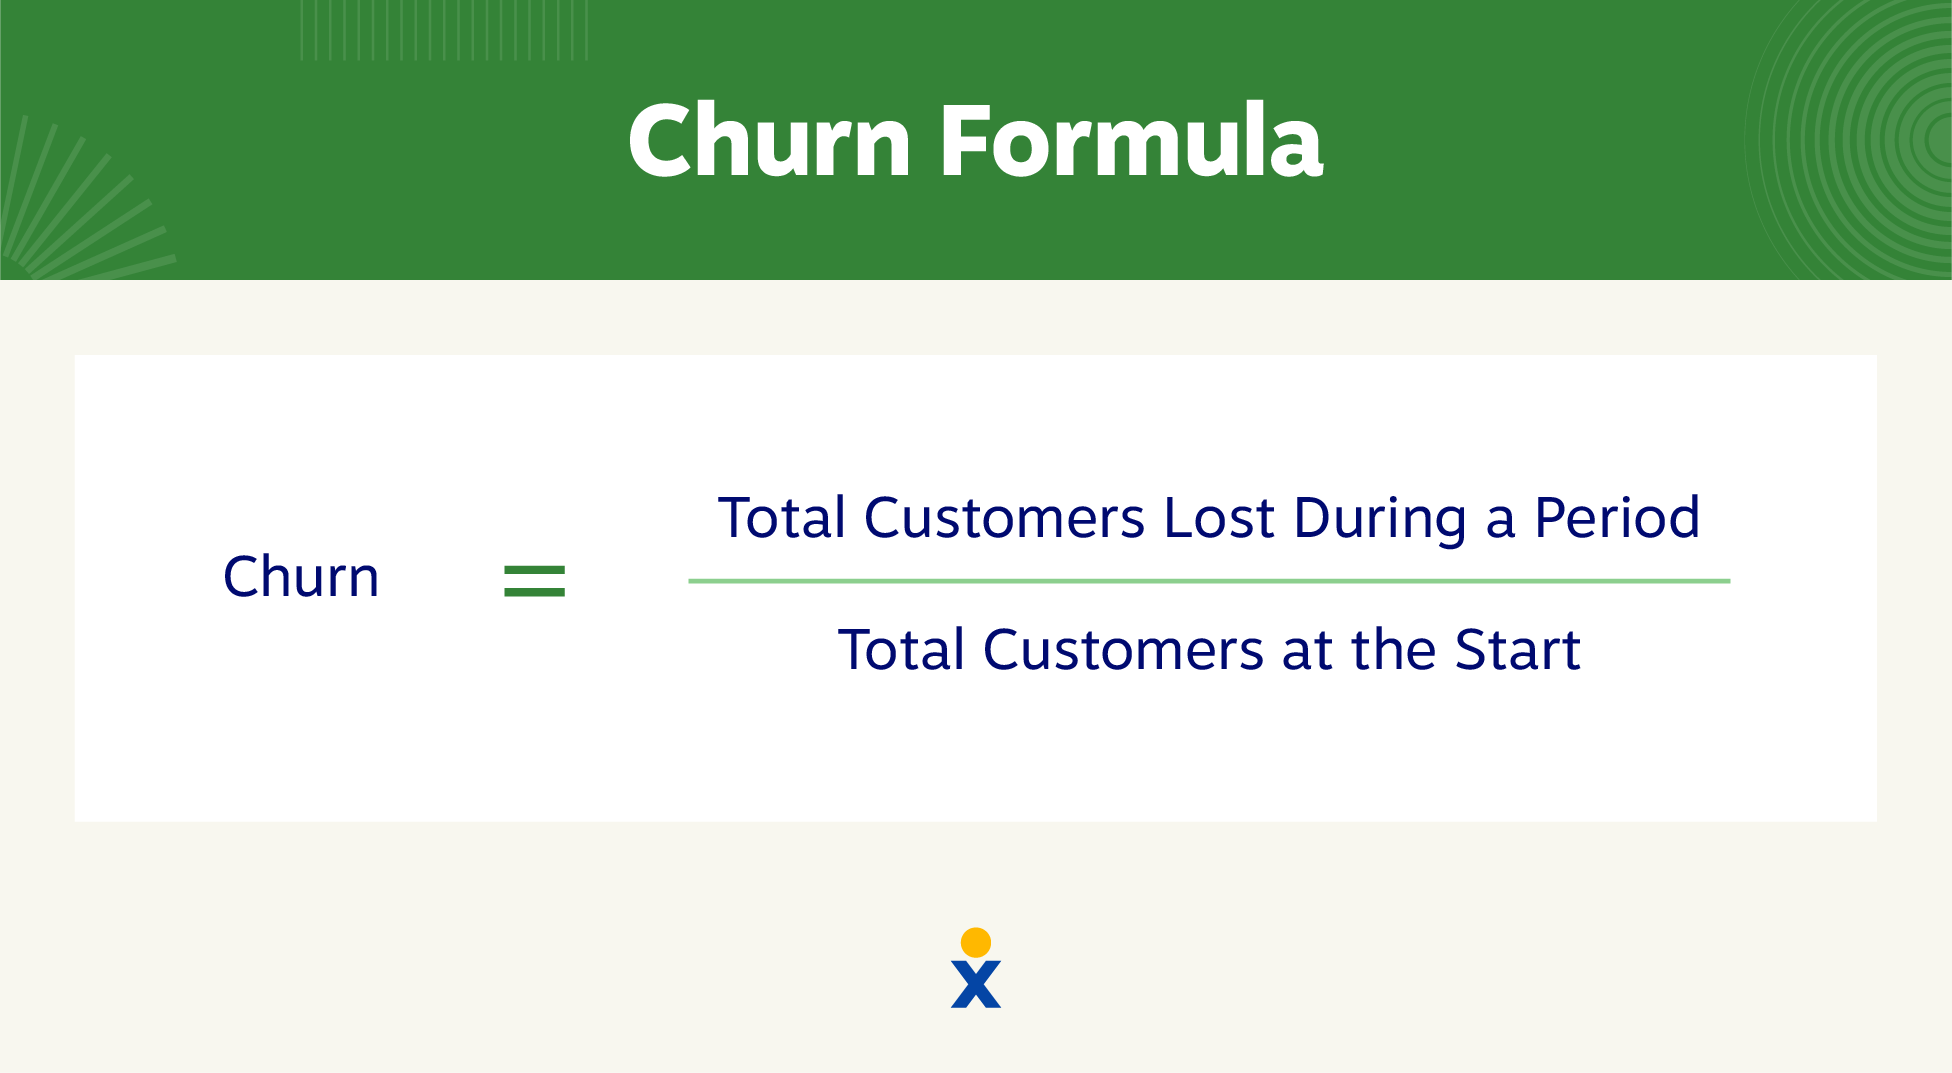
For example, if you had 100 customers last year, and 12 months later, you have 50 of those same customers. This means your churn rate is 50%. (Over 12 months)
There is no unified time for churn, but many companies calculate it by weeks, months, or quarters. Churn rates over different periods can give you insights into how different variables affect customer retention. For example, if you introduced a new CRM in June, churn for the calendar year might look different in the year’s first half compared to the second half.
It all depends on the industry, type of service, and contracts. A social media app might go as far as to calculate churn by the day. A real estate management company might calculate it by the year.
| 💡How to improve it: Spotlight the customer journey points where most churn happens and redirect resources to improve that pain point. |
17. Repurchase Rate
For companies that don’t sell subscription-based products (like e-commerce), the repurchase rate can be a key indicator of customer satisfaction.
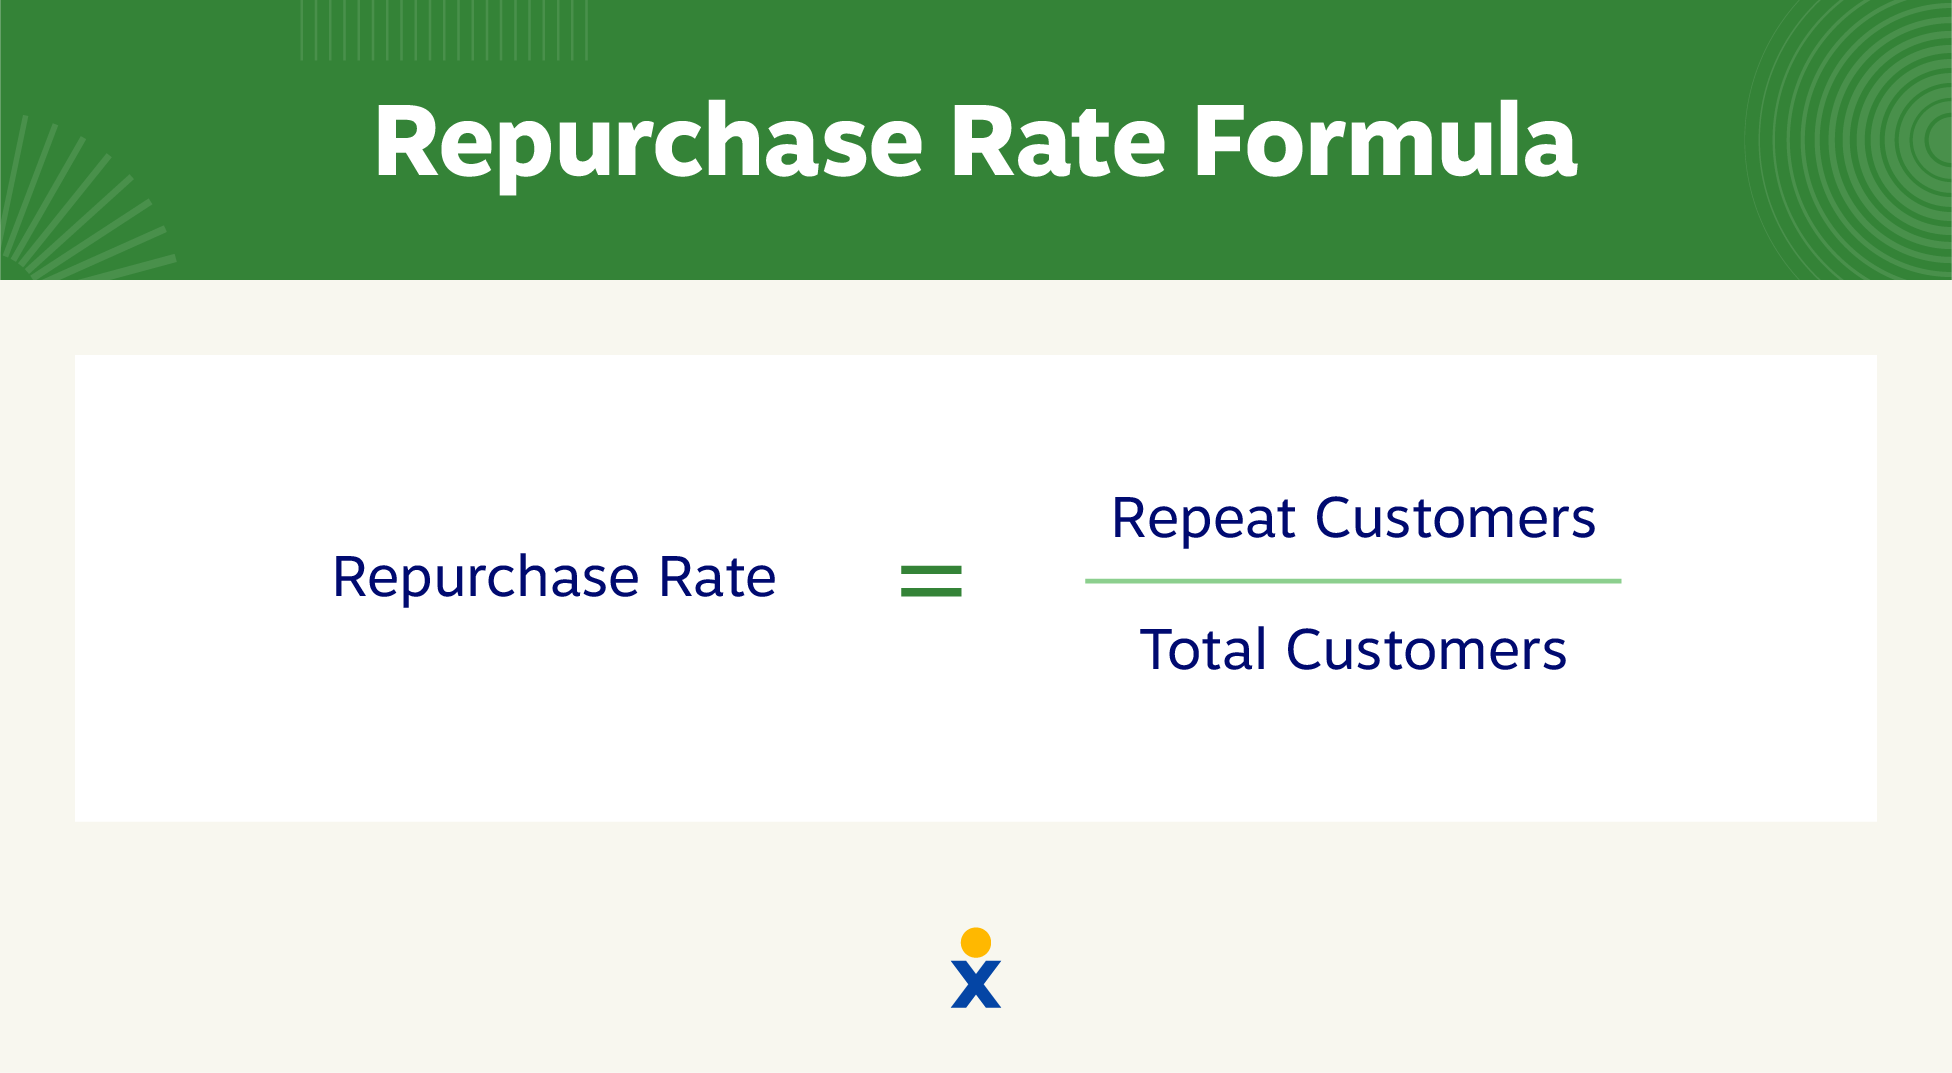
If you have a high rate of repeat customers, your customer service squad is likely doing its job right. Especially considering how quickly bad experiences affect customer behavior, customer trust takes time to build.
Repurchase rate can be difficult to measure if you sell consumer goods through retailers. You’ll only be able to measure it if your customers sign up for product insurance, register the purchase, or contact customer service on their own.
The product literature that you provide to customers is crucial here. Think about using a QR code or a simple guide that educates customers on how to use your product best and tutorials that reduce the likelihood of a return. All in all, it adds up to a more well-rounded customer experience.
| 💡How to improve it: Build a loyalty program that creates value for customers and defines incentives for them to make (and record) return buys. |
Grow Your Capabilities With Comprehensive Customer Data
Unified communication tools help measure every step of the customer journey across multiple channels. You can isolate metrics like first response time and average number of interactions per ticket to visualize the satisfaction of each customer account.
With a grasp on vital customer service metrics, you can spot precisely where your team needs to improve most.
Net Promoter, Net Promoter Score, and NPS are registered trademarks of Satmetrix Systems, Inc., Bain & Company, Inc., and Fred Reichheld.
Customer Service Metrics FAQs
The best KPIs for customer service measure the entire customer experience and map the journey from beginning to end. These include customer satisfaction score, average wait time, first contact resolution, average resolution time, and more.
Service-level metrics are internal metrics companies use to benchmark their customer service goals. These metrics aren’t made publicly available. They are often called SLAs and measure how many customer inquiries happen within a given time frame.
One of the best ways B2B companies can measure customer service ROI is with artificial intelligence (AI) tools. With conversational AI and other customer support tools, you can analyze interactions and grab key insights like issue resolution rate, purchase frequency, and more.